China Plus One, by the Numbers: Small Businesses Tripled Payments to Vietnam in 2026
What more than 240,000 payments to and from Hong Kong small businesses reveal about the trade war, the dollar and "China plus one".

Founder · November 2026 · 14 min
Statrys is a Hong Kong-based fintech company that gives SMEs a digital back office: company registration, accounting and multi-currency business accounts.
Small businesses use Statrys to pay suppliers and get paid across borders. This report draws on those payments, aggregated and anonymised, to show how Hong Kong SMEs are actually trading. Statrys is not a bank; see our licences.
Hong Kong's small businesses sent three times as much money to Vietnam in the first nine months of 2026 as a year earlier. They did not send less to China.
Payments to China grew 11%, and China still received about a quarter of everything these firms paid out. That is not the story the trade war was supposed to produce: companies leaving China, the world moving away from the dollar, and Hong Kong losing its place as the city where trade with China gets done.
Big-company data already complicates that script. 71% of AmCham China member companies say they have no plans to relocate manufacturing or sourcing out of China (AmCham China, January 2026), and the dollar still holds 56.7% of the world's foreign exchange reserves against 2.1% for the renminbi (IMF COFER, September 2026).
What has been missing is the view from small businesses. We analysed the payments of Hong Kong-incorporated SMEs with a Statrys business account, and the FX conversions of all Statrys business account clients, January to September 2026 against the same months of 2025.
Hong Kong-incorporated SMEs, Jan–Sep 2025 → Jan–Sep 2026. Shares of payment value.
Five things everyone says about trade in 2026. Here's what the payments say.
Left column: published sources for each view. Right column: Statrys payment data, Hong Kong-incorporated SMEs, Jan–Sep 2026 vs Jan–Sep 2025.
The supply chain got longer, and the money followed it.
The headlines say companies are leaving China. Our clients' payments say small traders kept their Chinese suppliers and added new ones in Vietnam and Thailand.
Download the charts
All nine charts in this report, in high resolution. Free to republish with credit to the Statrys SME Trade Flows Report 2026 and a link to this page. No sign-up needed.
Trade spread out rather than stopping
Hong Kong SMEs sent 15% more payment value than a year earlier, and Southeast Asia took a bigger slice of it.
The number of outgoing payments grew 16%, almost in line with value, so the average payment size stayed flat (−1%). Growth came from more payments to more places, not from bigger tickets.
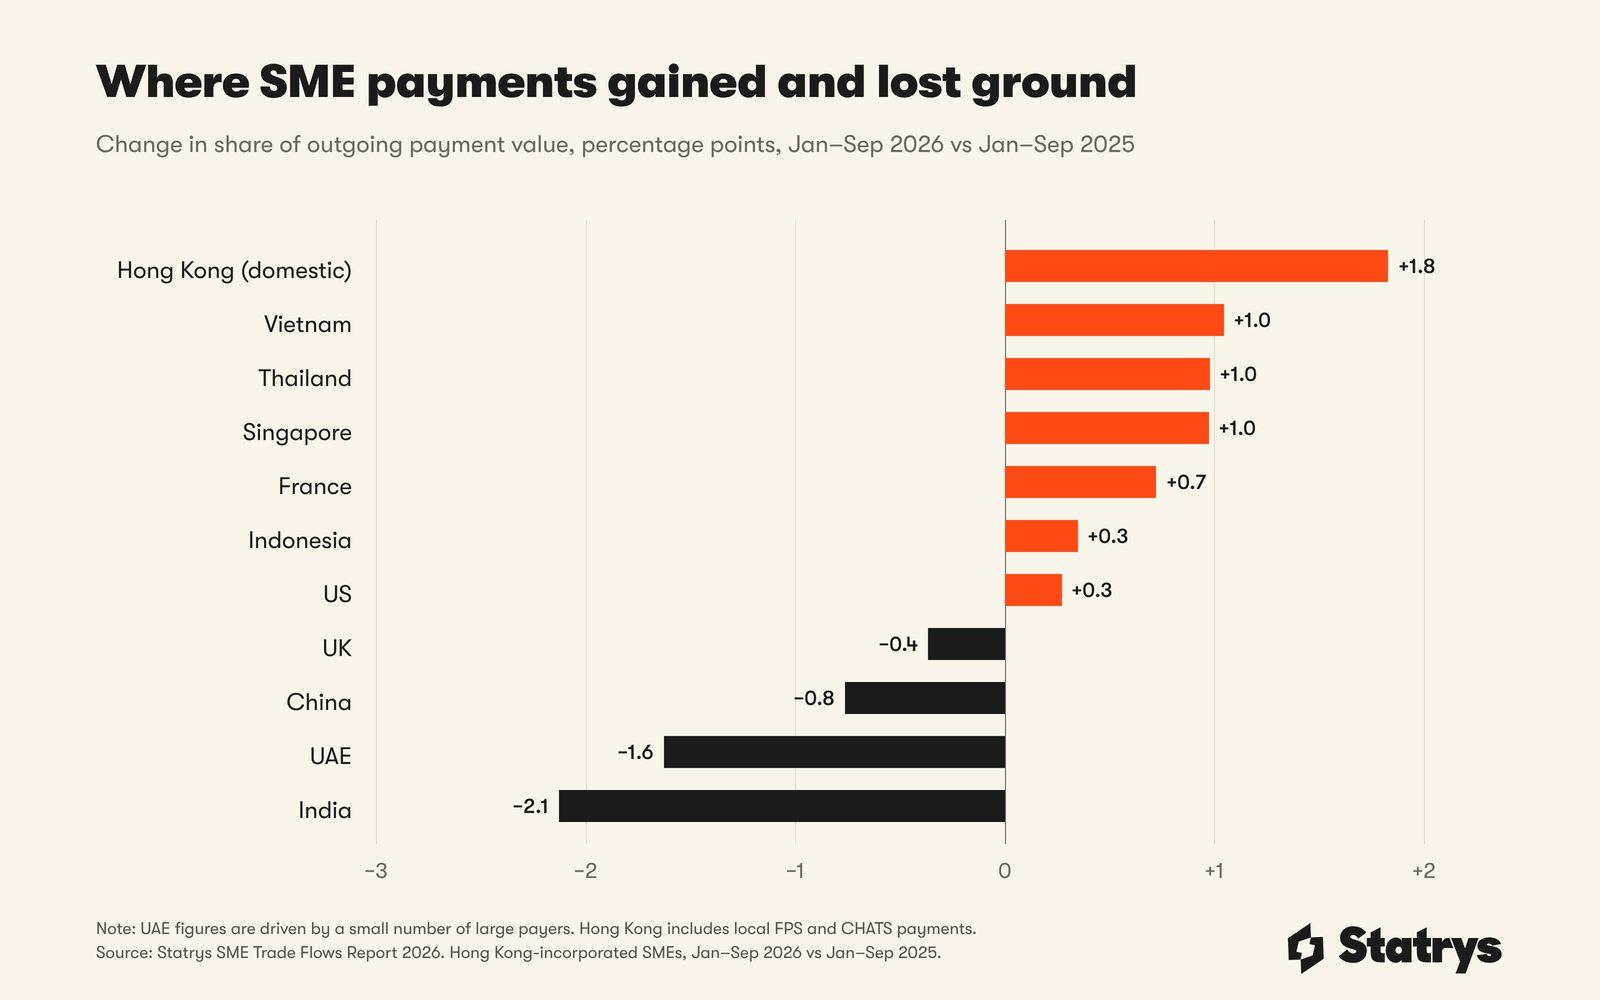
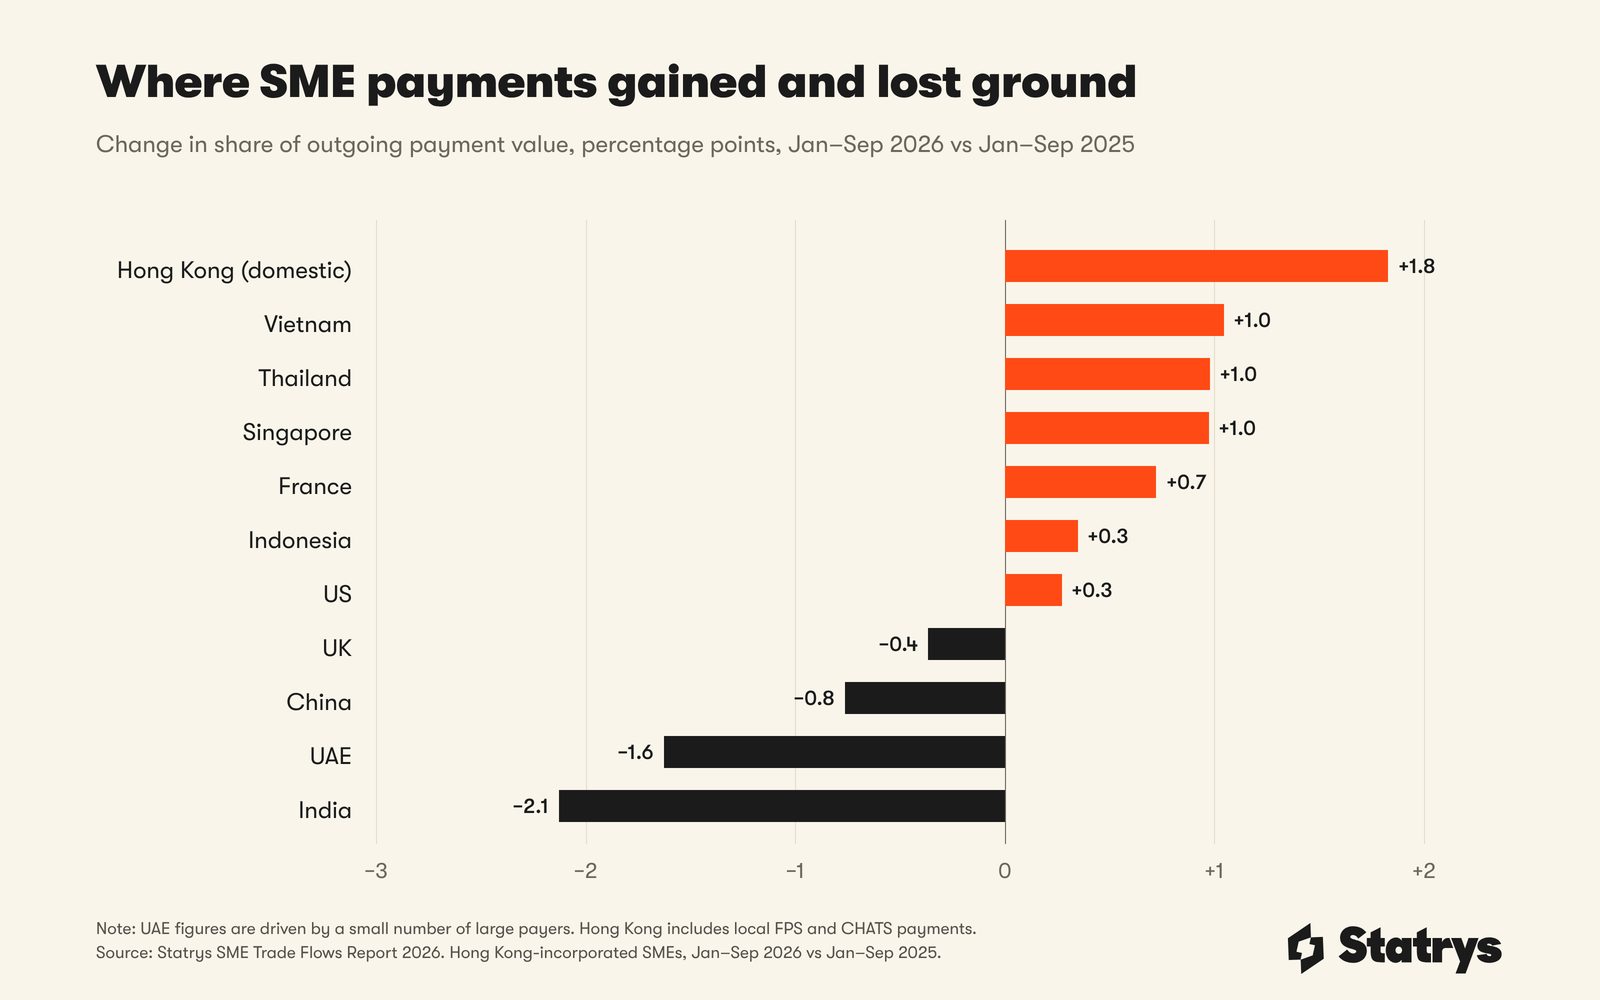
The 11 members of ASEAN took 12.5% of outgoing payment value, up from 9.2%. Payments to the region grew 56%, almost four times as fast as payments overall. Excluding Singapore, often a regional hub for treasury and sales, the share still rose from 4.4% to 6.7%.
China's share barely moved, slipping 0.8 percentage points. China's share was unusually high in early 2025, which explains most of that dip: leave out January to March and China's share actually rose.
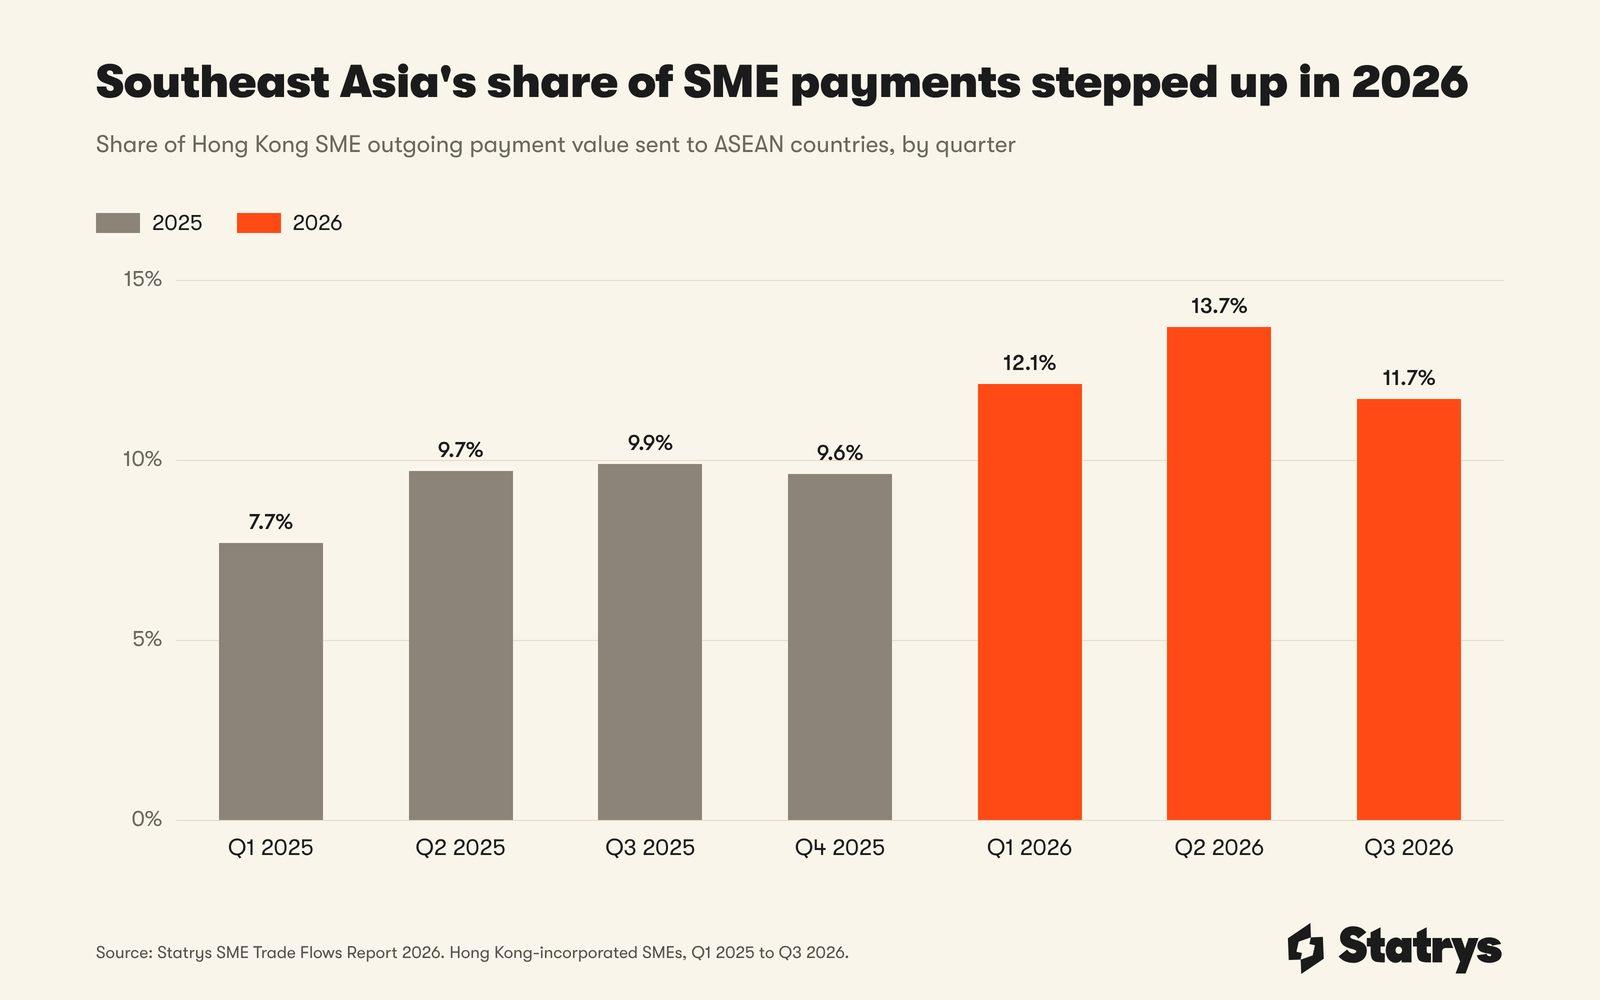
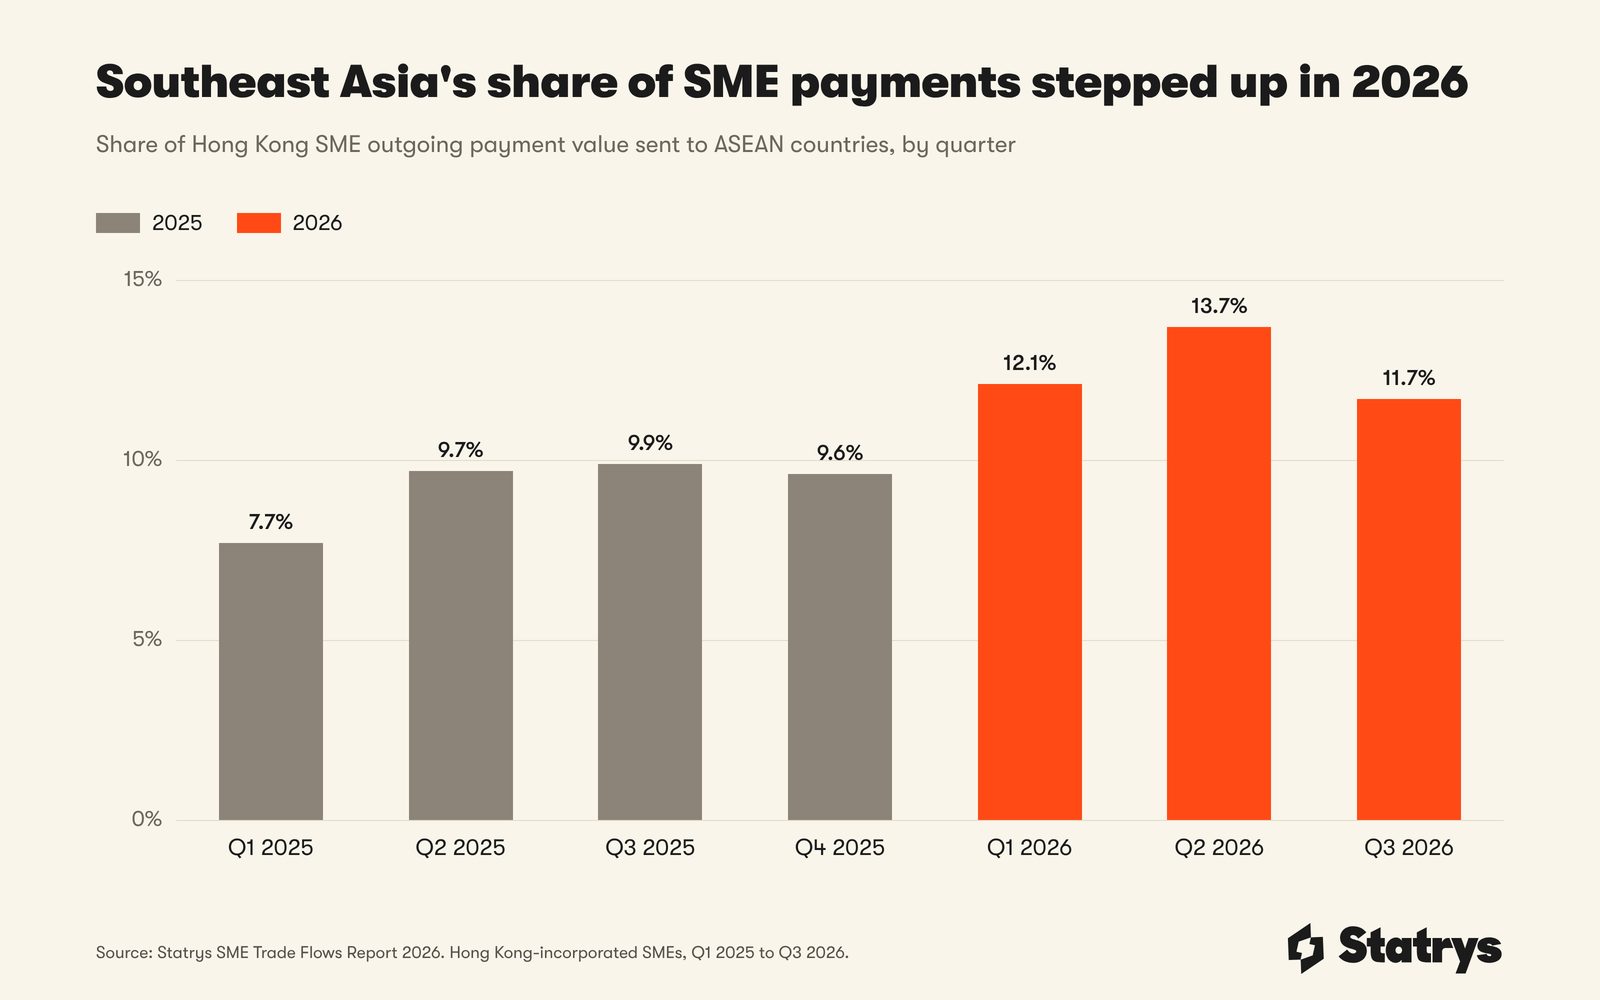
The step up in Southeast Asia is visible quarter by quarter. ASEAN's share sat between 7.7% and 9.9% in each quarter of 2025, then reached 12.1% and 13.7% in the first two quarters of 2026. It eased to 11.7% in the third, still above every quarter of 2025.
The pattern matches the global picture. The WTO raised its 2026 forecast for world merchandise trade growth to 3.9% and expects Asia to post the fastest export growth, at 9.9% (WTO, October 2026). China's trade with ASEAN grew 22.7% in the first nine months of 2026, to RMB 6.84 trillion (China customs, via gov.cn, October 2026). In the first half, its trade with Indonesia, Vietnam and Thailand each grew more than 20% (The Nation, July 2026): the same three of our fastest-growing corridors.
2025 2026 · Source: Statrys SME Trade Flows Report 2026. Hong Kong-incorporated SMEs, Jan–Sep.
China plus one, in small-business form
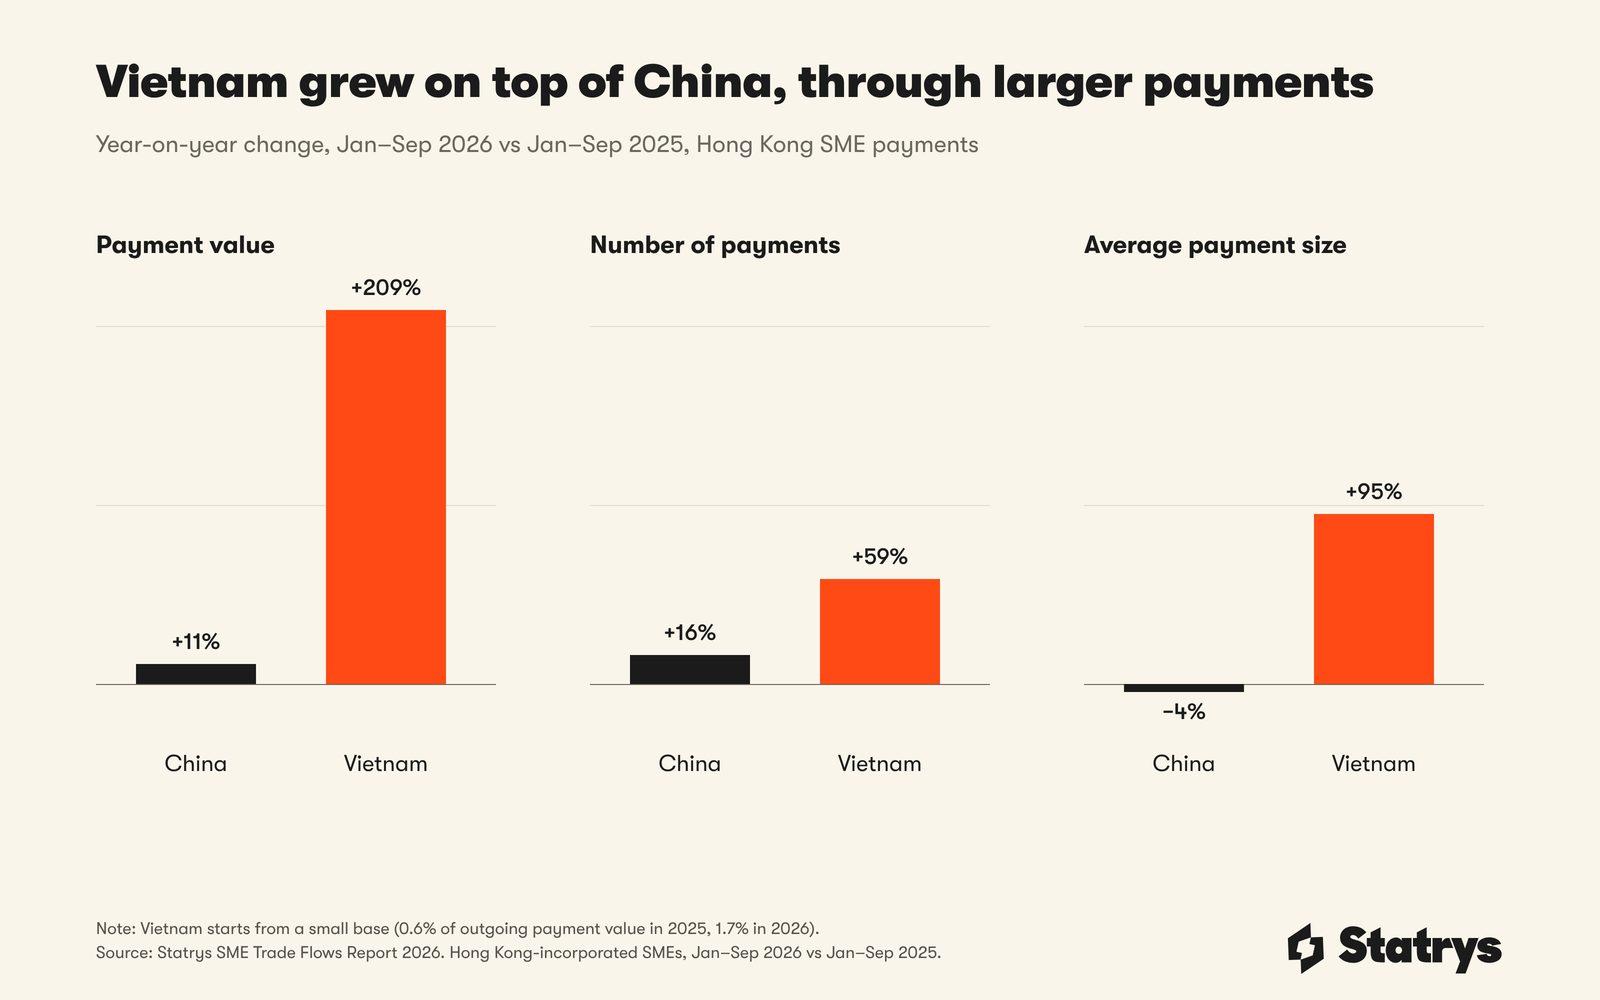
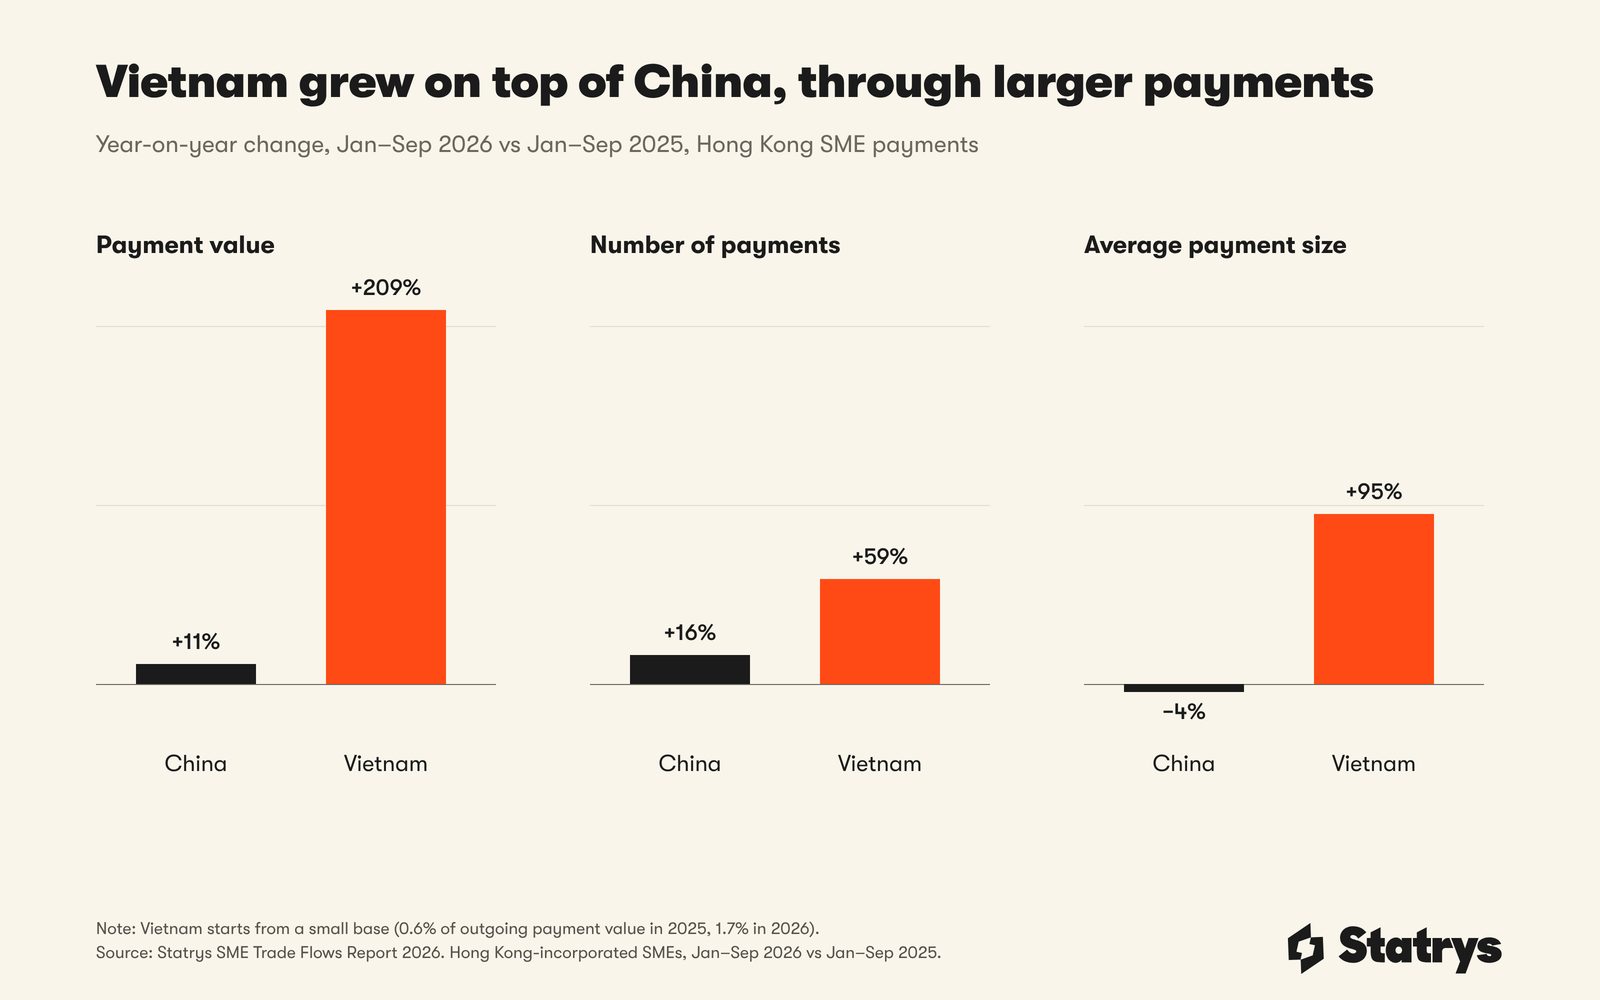
SMEs added Vietnam without dropping China. Payments to Vietnam grew 209% while payments to China grew 11%.
"China plus one" describes companies keeping Chinese production while adding a second manufacturing country. The New York Fed found that, between 2024 and 2025, the US deficit with China in machinery and electronics fell by about USD 70 billion, while the deficit with ASEAN in the same goods rose by about USD 80 billion, with Vietnam the largest single driver (Liberty Street Economics, May 2026).
Small traders appear to follow the same route. Our data shows where money goes, not what it pays for, but the pattern fits: assembly is moving, many suppliers behind it remain Chinese, and SMEs end up finding new suppliers while keeping the old ones.
Vietnam's exports grew 24.5% in the first nine months of 2026, but imports grew 36.7%, and USD 187.3 billion of them came from China (NSO, via VietnamPlus). New factories in Vietnam run on Chinese inputs, which is why a trader adding a Vietnamese supplier usually keeps paying Chinese ones too.
Vietnam: more payments, much bigger ones
The number of payments to Vietnam grew 59%, far more slowly than their value, and the average payment nearly doubled (+95%). Growth came mainly from larger payments rather than many more of them, typical of a manufacturing base still being tested. China is different: payments grew 16% in number and dipped 4% in size.
India: more payments, smaller amounts
India's share fell from 4.5% to 2.4% and the value sent dropped 40%, yet the number of payments rose 32% and the average size fell 54%: Hong Kong SMEs are making more payments to India, in smaller amounts. The data does not show why, though a shift towards services would fit.
Europe and the United States: different directions
Payments to the EU grew 27% and to the US 20%, but money received from the United States fell 1%.
Europe: more payments, fewer euros
EU countries took 14.6% of outgoing value, up from 13.3%. Payments to France grew 36% and to Germany 35%, while payments to the UK were flat (+2%). The euro's overall decline came mostly from outside the EU: euro payments to EU countries still grew 10%, while those to other destinations fell 30%. Hong Kong SMEs are using the euro less as a general trade currency and more as a currency for Europe alone.
The United States: paying more, getting paid less
The timing coincides with new US tariffs. From 24 July 2026 the US added Section 301 tariffs of 12.5% on goods from the Chinese mainland and Hong Kong (Trade and Industry Department), while Hong Kong's total exports to the US were still up 63.4% in the first eight months (HKTDC Research, September 2026). Those headline exports are dominated by electronics shipped by large firms. Smaller businesses appear to be earning less from US customers while still paying more to US counterparties.
The Gulf: smaller in both directions
Read the size of the UAE drop with care. Its direction is consistent with the WTO's forecast that Middle East merchandise export volumes will contract 17.2% in 2026 (WTO, October 2026).
Who is paying Hong Kong SMEs
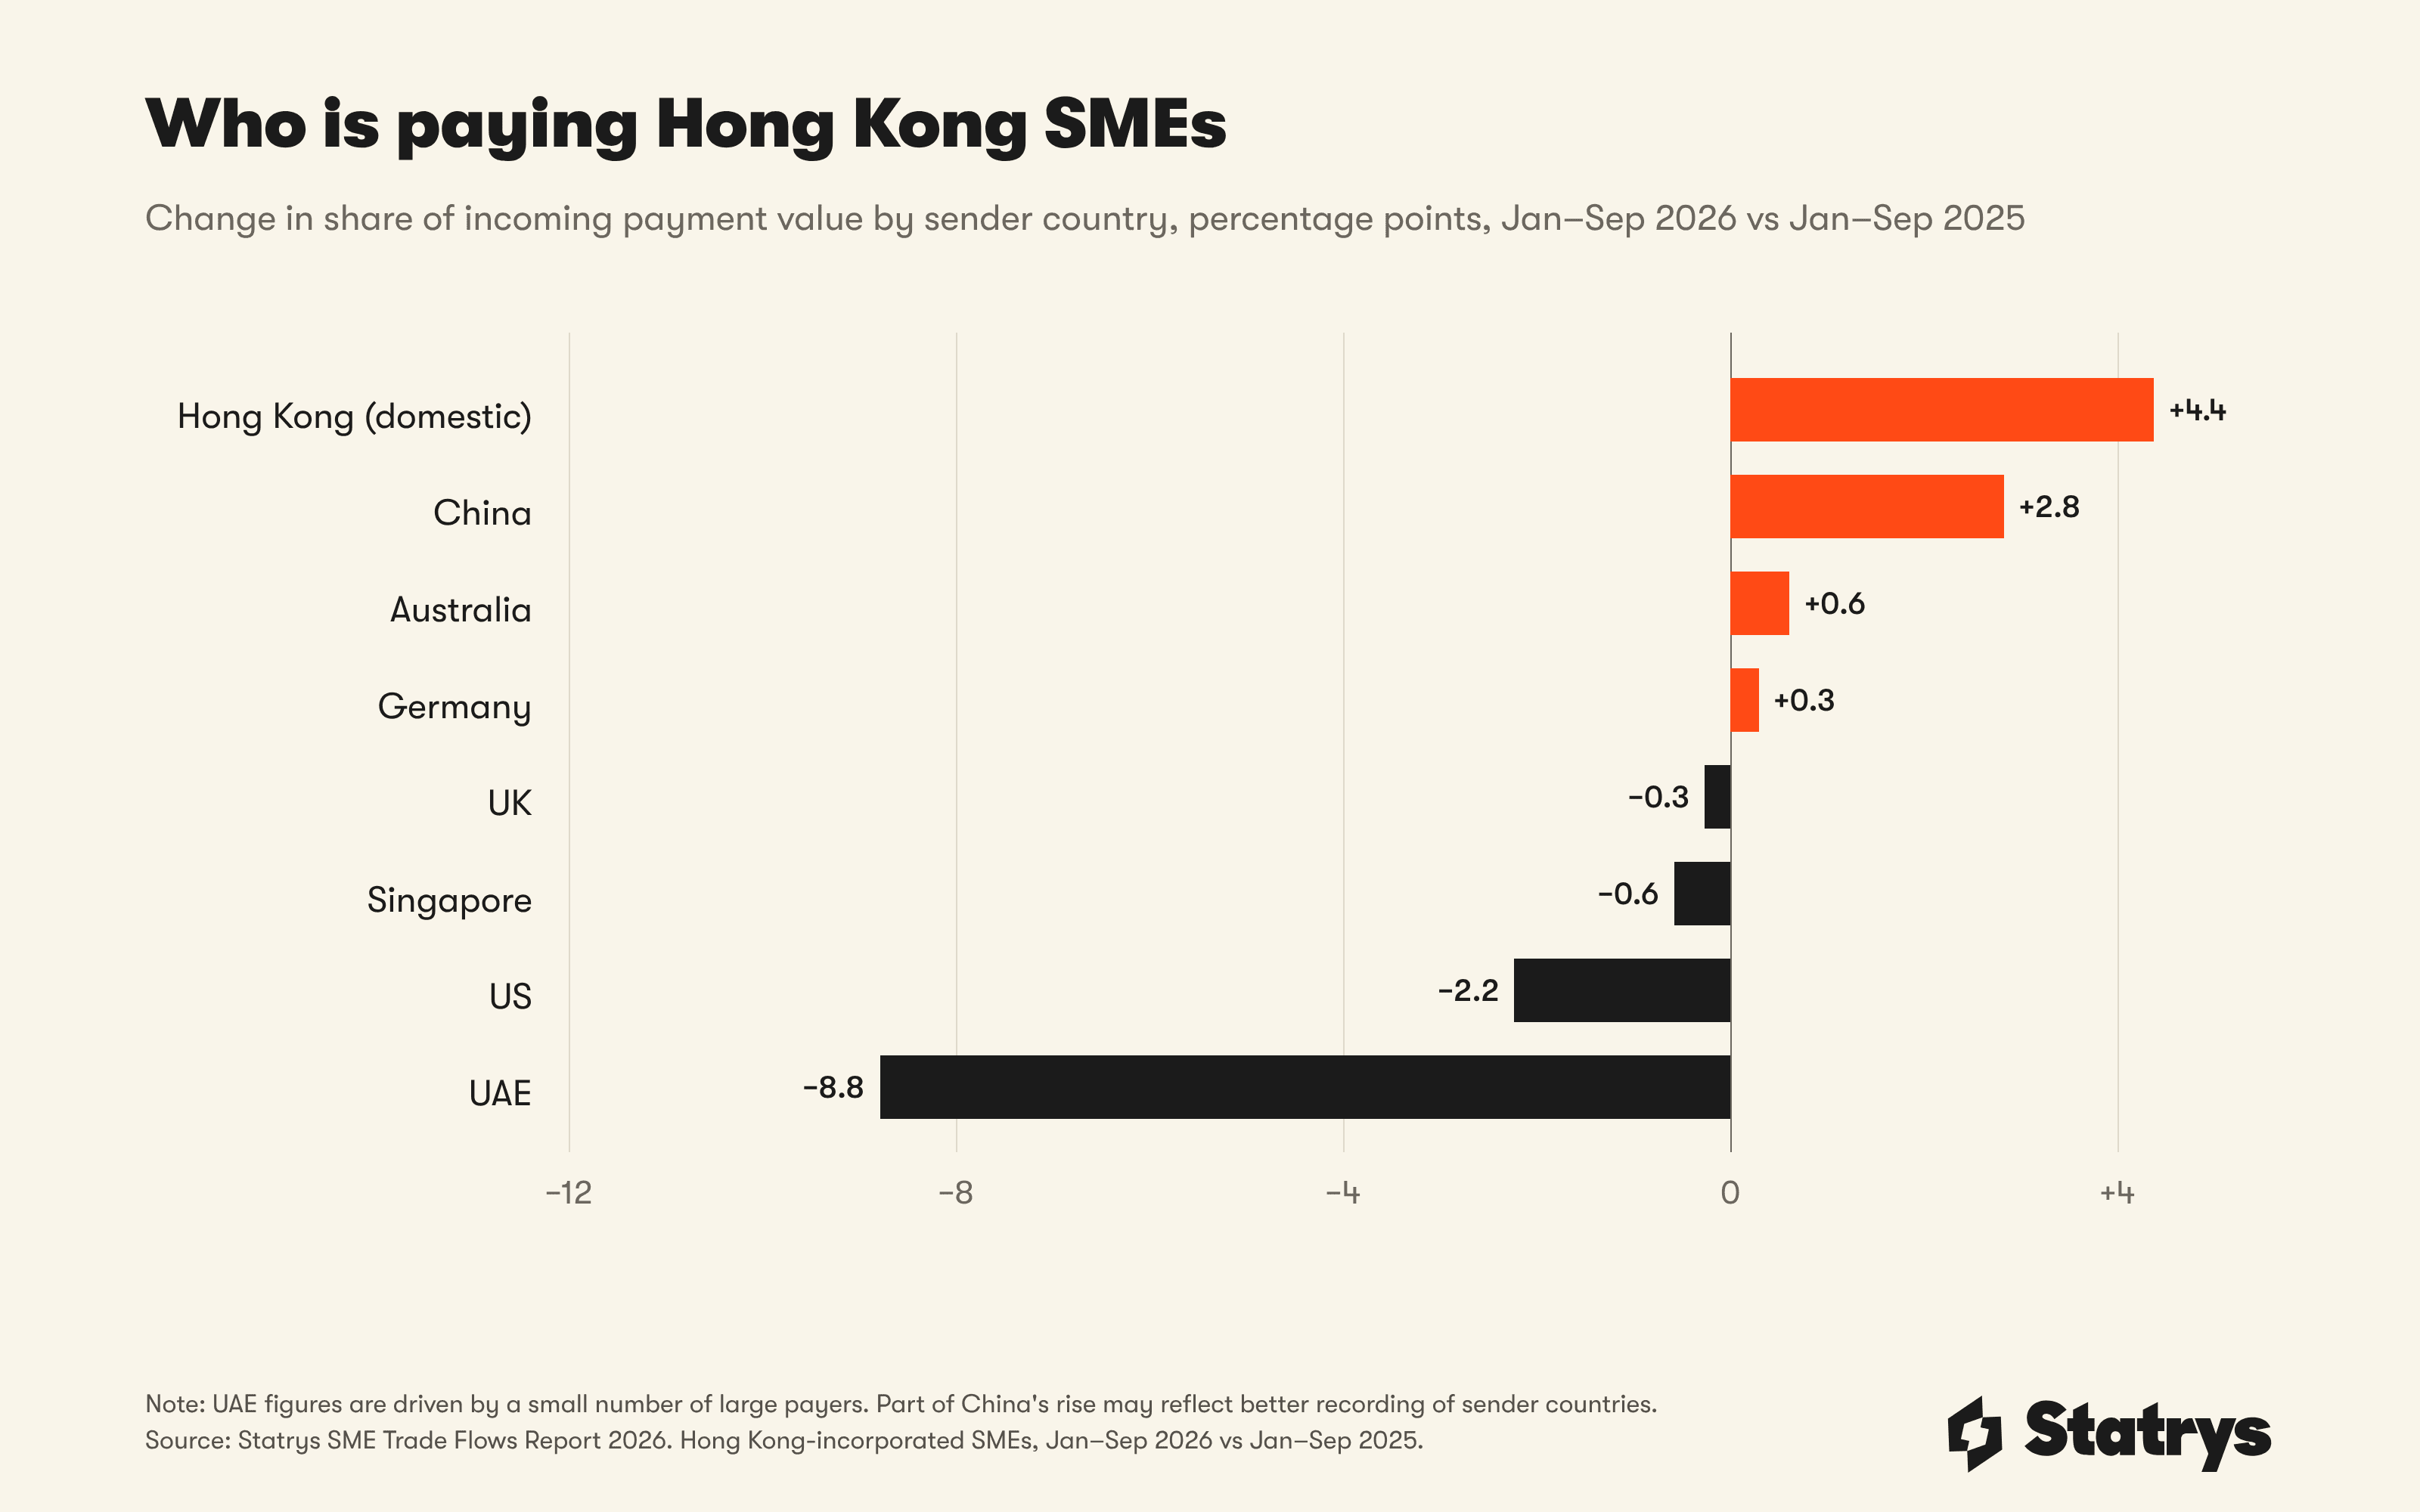
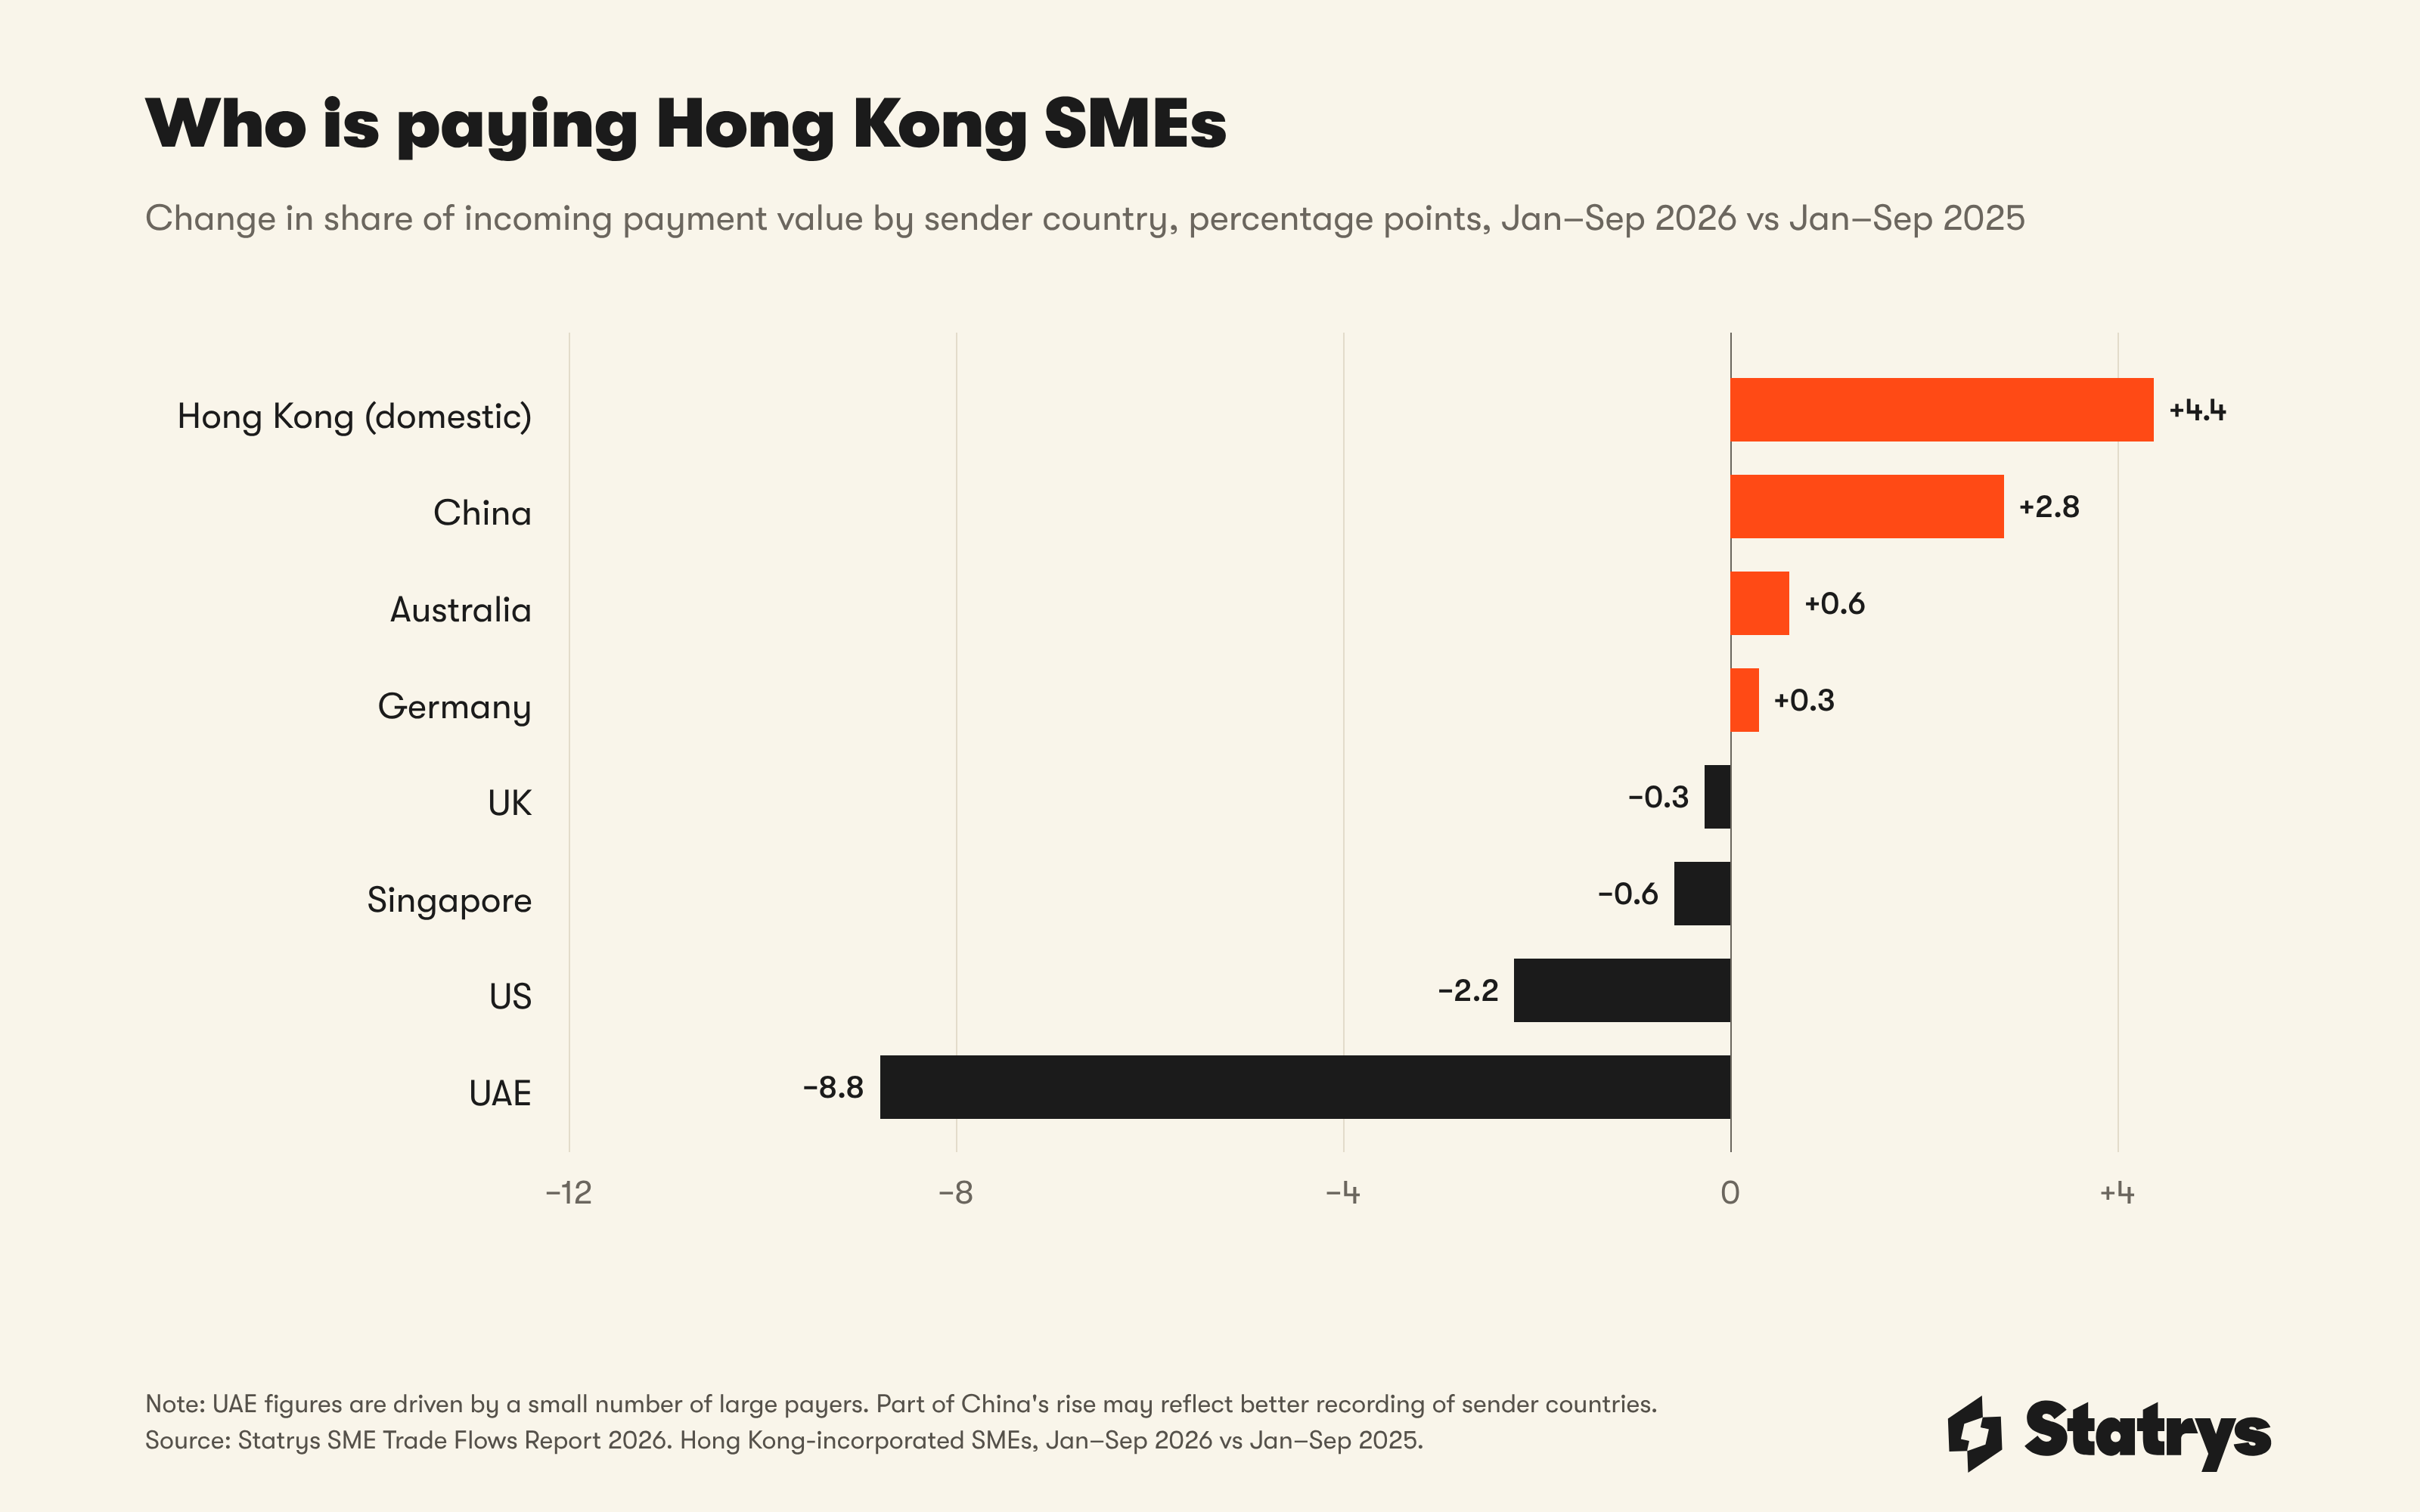
Incoming payments grew 16% in value and 28% in number: SMEs are getting paid more often, in smaller amounts, and closer to home.
| Sender | Share 2025 → 2026 | Growth |
|---|---|---|
| Hong Kong | 27.0% → 31.4% | +35% |
| United States | 15.1% → 12.9% | −1% |
| United Kingdom | 5.3% → 5.0% | +10% |
| China | 2.5% → 5.3% | +150% |
| Australia | 1.5% → 2.1% | +64% |
| Germany | 1.5% → 1.8% | +38% |
| UAE | 12.5% → 3.8% | −65% |
Hong Kong customers now make up almost a third of SME receipts. China more than doubled its share and ASEAN rose from 9.5% to 11.1%. Part of China's rise may reflect better recording of sender countries: unknown senders fell from 8.7% to 4.0% of incoming value.
The dollar still settles SME trade
The dollar's share of outgoing payments rose from 68.7% to 72.0%, and it carried 83.4% of payments to China.
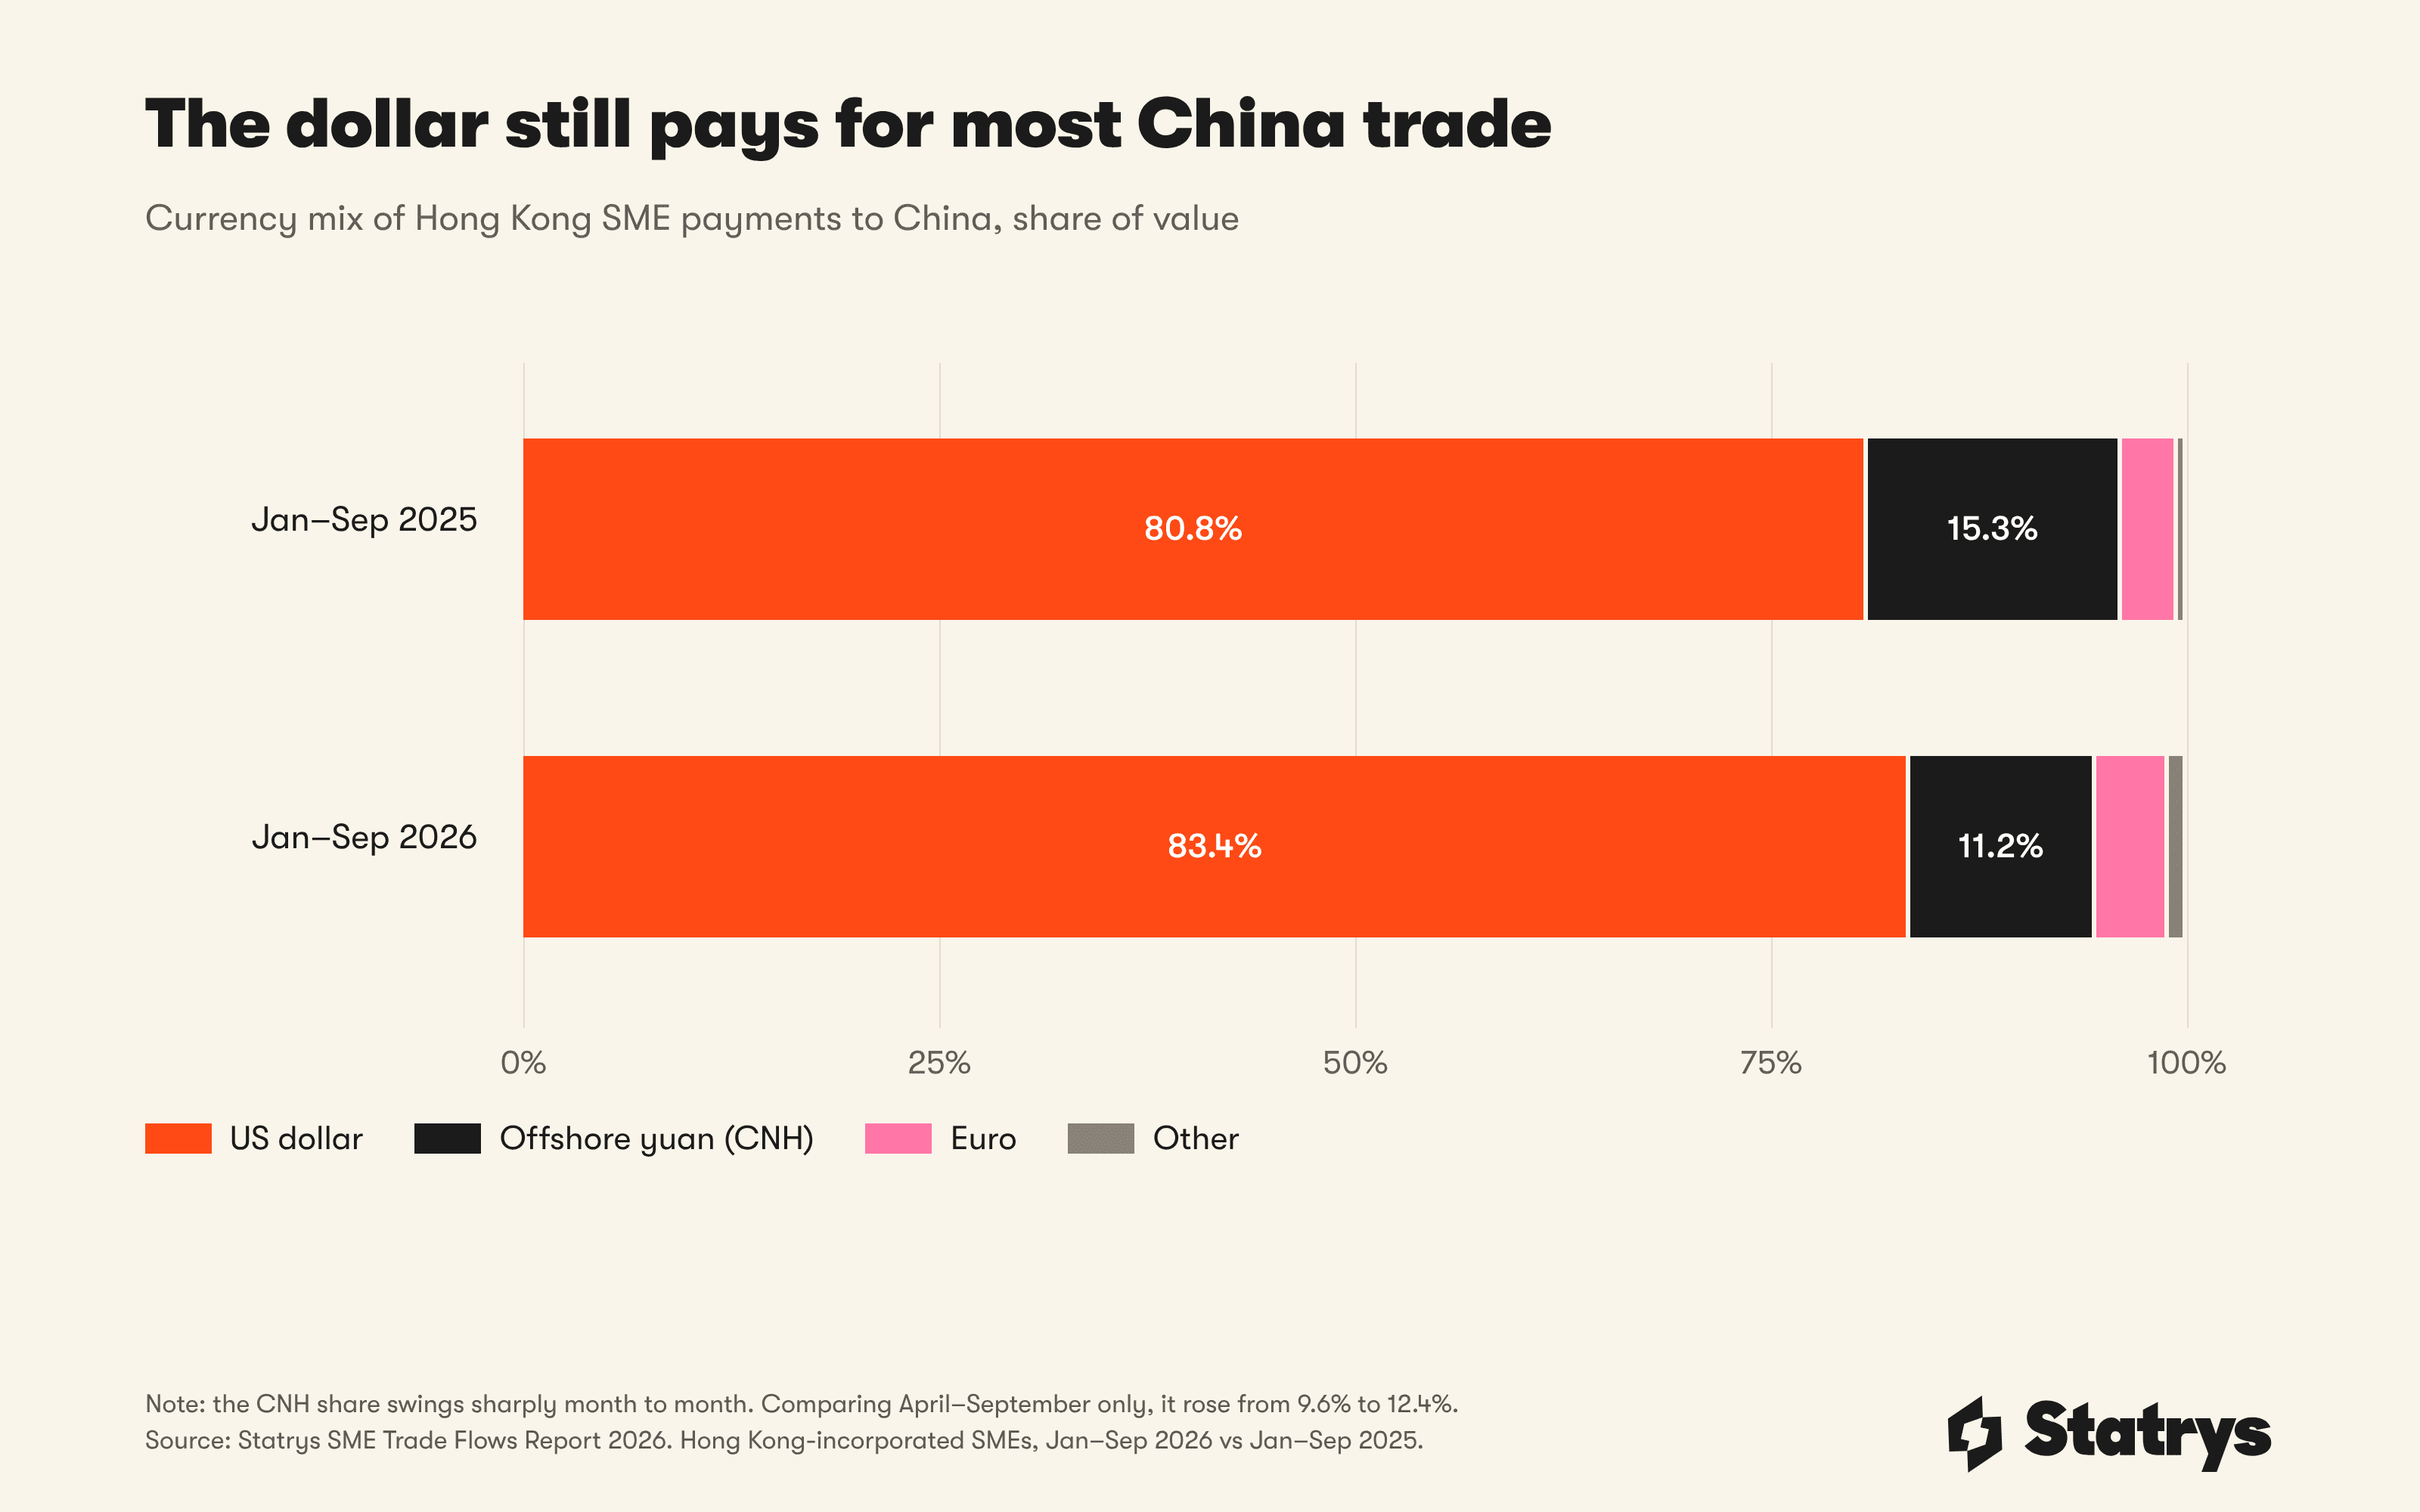
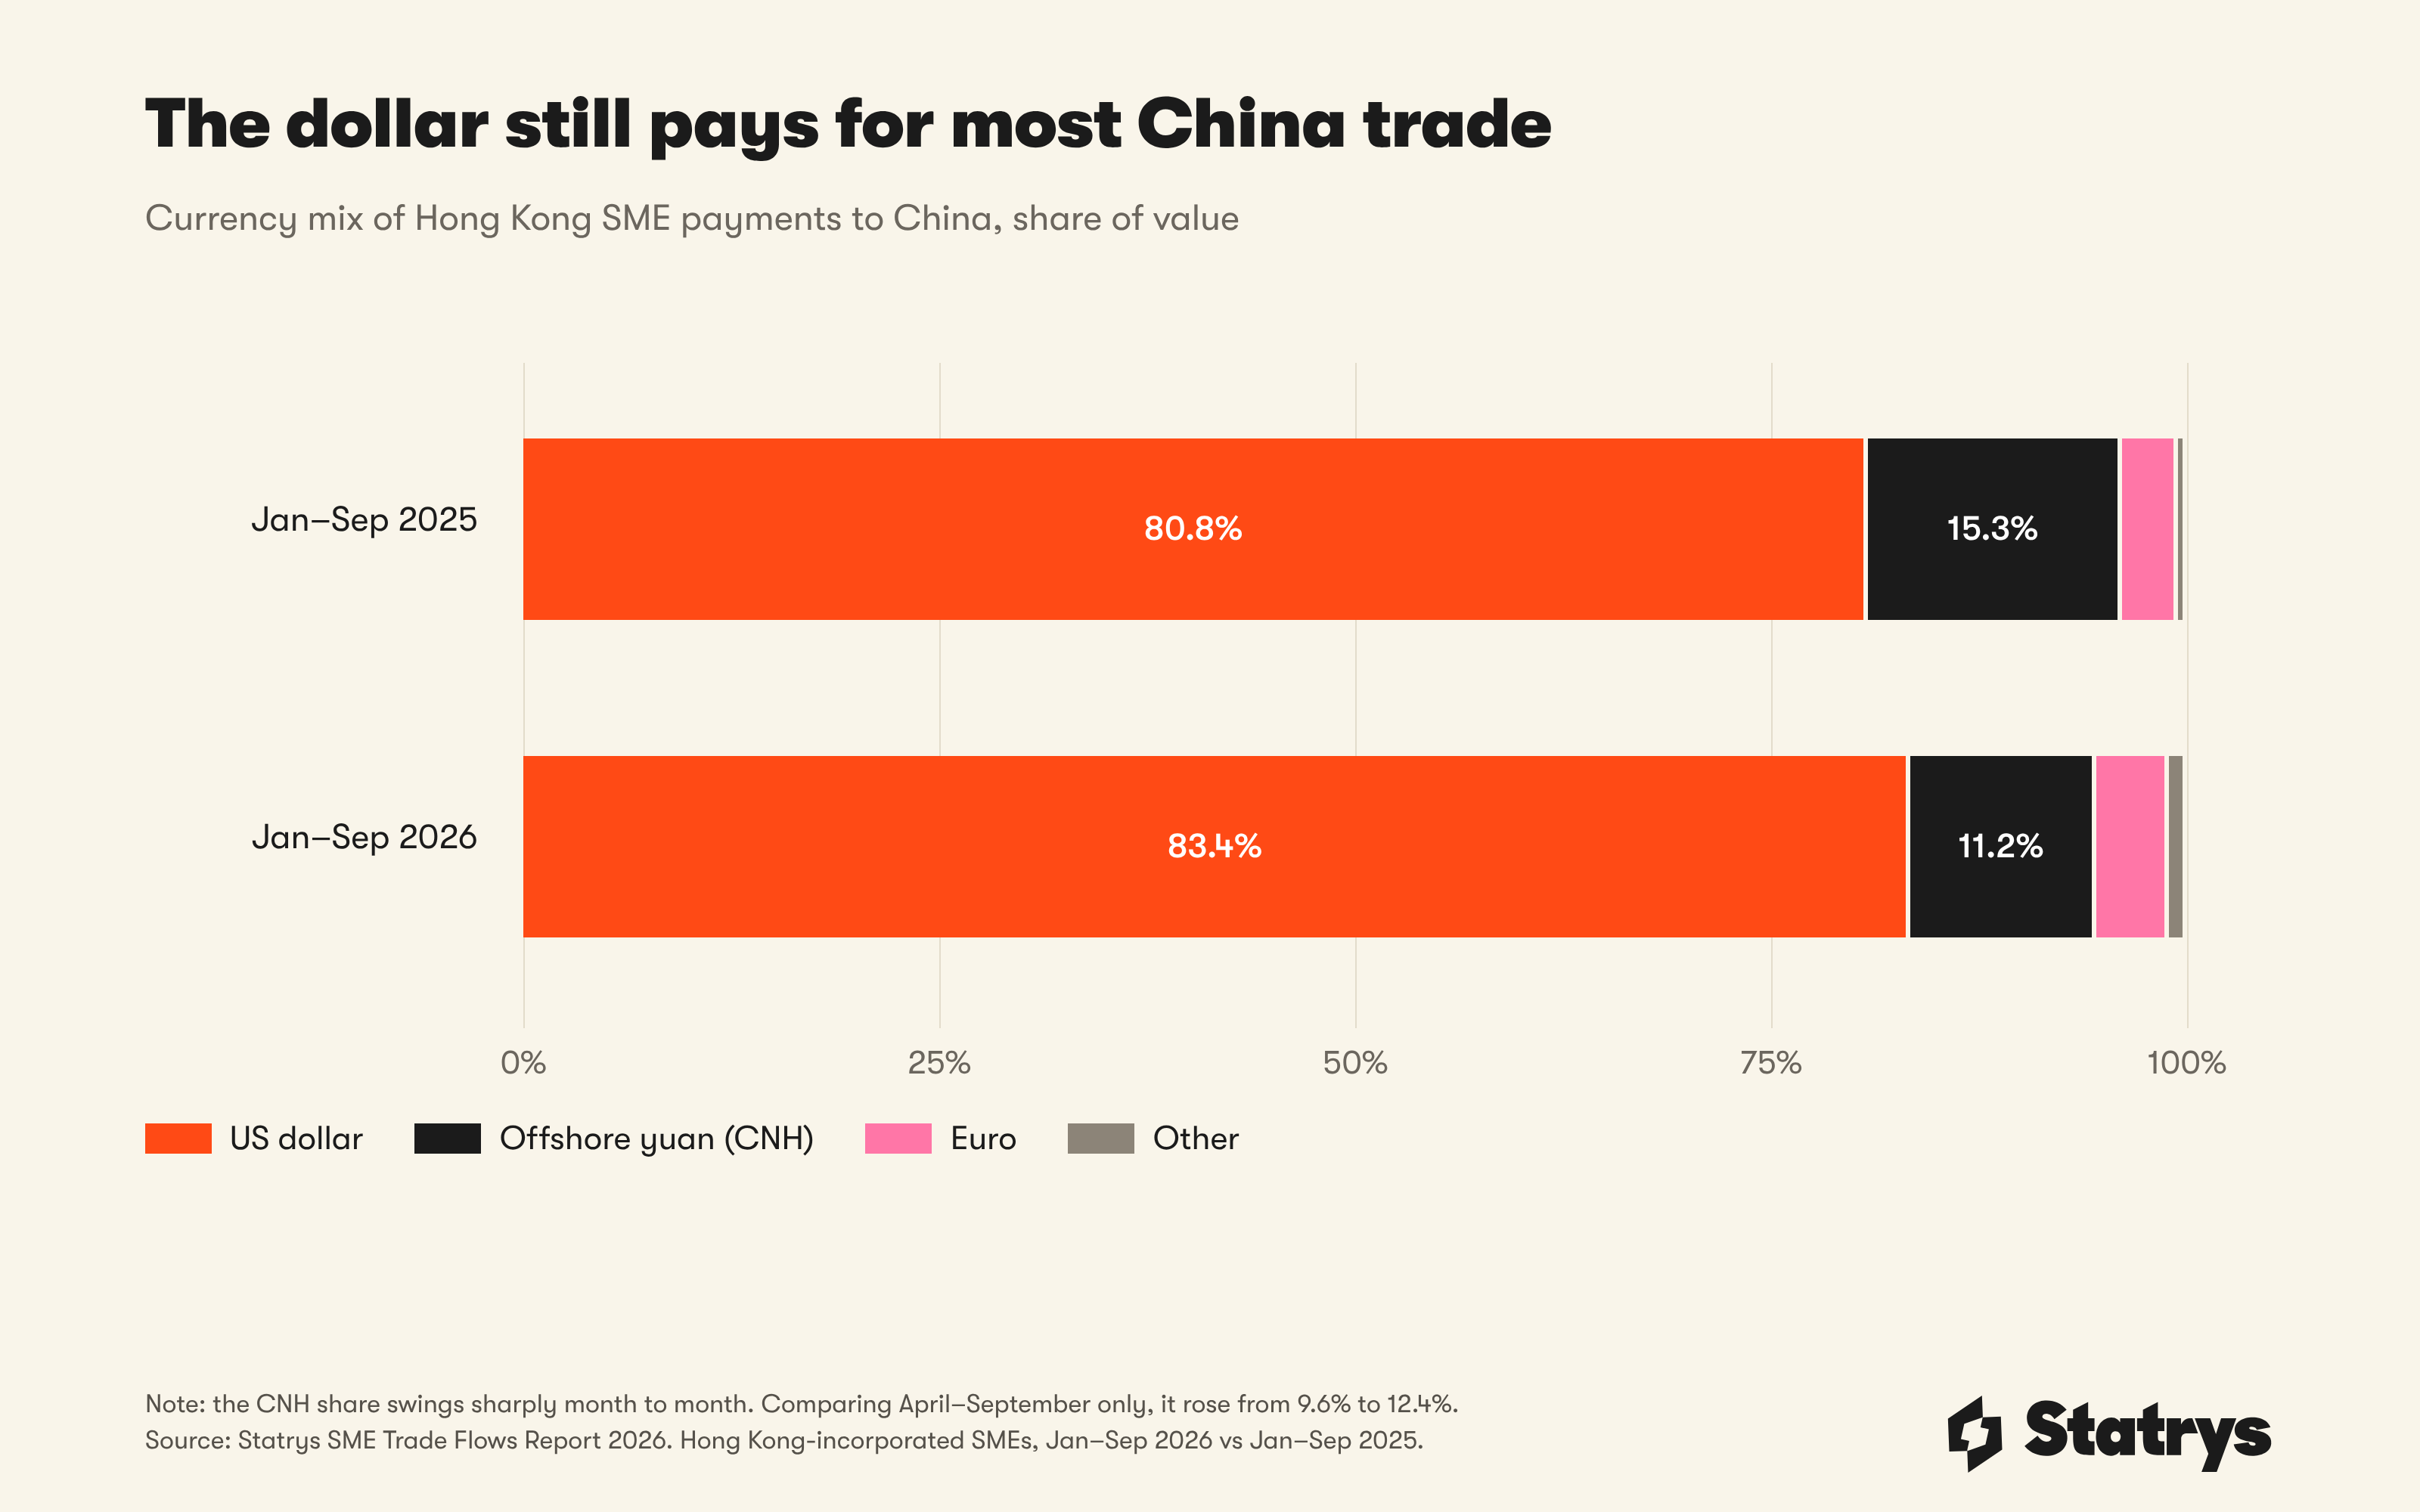
Despite the debate over "de-dollarisation", Hong Kong SMEs used the dollar for a larger share of payments in 2026, and the euro lost the most ground. The shift holds when the unusual early months of 2025 are left out (70.1% to 71.6% from April to September), though it is smaller. A weaker dollar raises the US dollar value of payments made in other currencies, which would push the dollar's share down, not up.
CNH, the yuan traded outside mainland China (see CNH vs CNY), is volatile as a share of payments to China: from about 5% to over 40% in single months of 2025. The drop from 15.3% to 11.2% is not a reliable trend. What is clear is that the US dollar carries more than 80% of the value paid to China.
Swift's September 2026 data puts the renminbi at about 2.4% of international payments by value (excluding the eurozone) against about 59% for the dollar, and 8.3% of trade finance against 82.1% (Swift, October 2026). In February, ING said it expected the dollar's 2026 decline to be "more cyclical than structural" (ING Think). Our data fits that reading: a softer dollar did not mean small businesses used it less.
Small businesses pay their invoices in whatever their suppliers accept, and in 2026 that was still mostly US dollars. What changed is that more of them now keep a yuan balance next to their dollars.
Yuan demand is building behind the payments
Conversions from US dollars into CNH grew 69%, more than three times the 21% growth in FX overall.
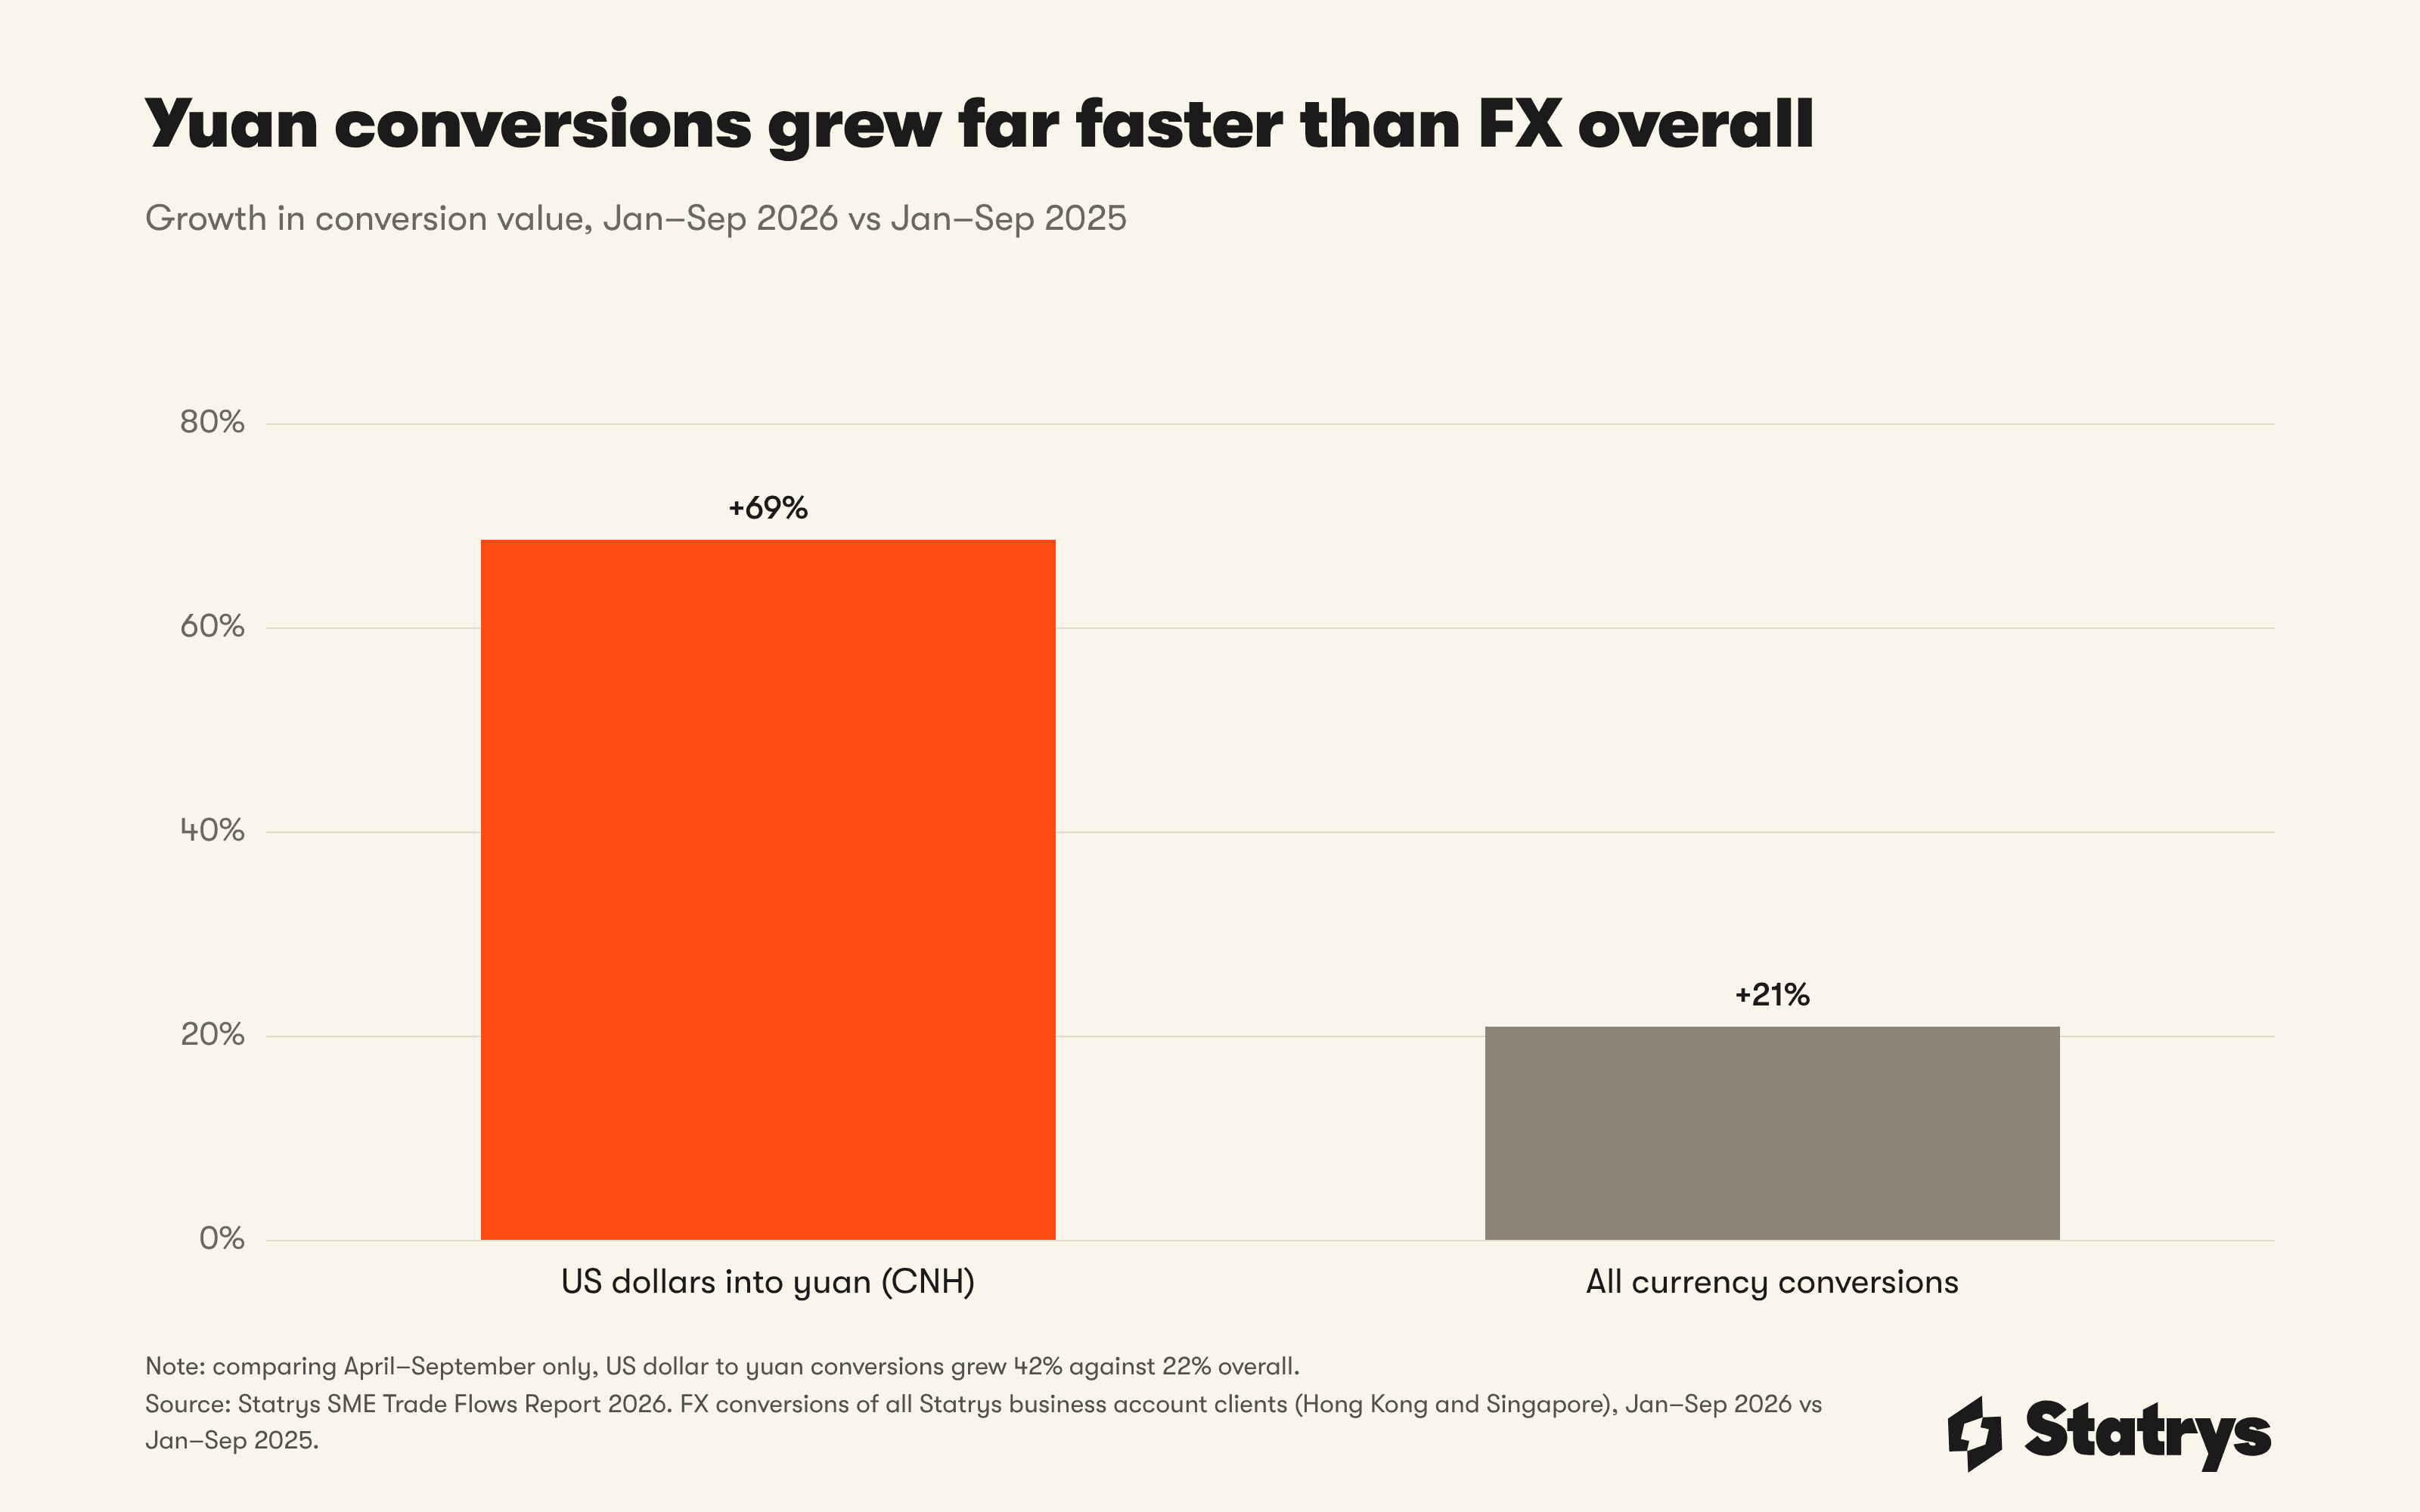
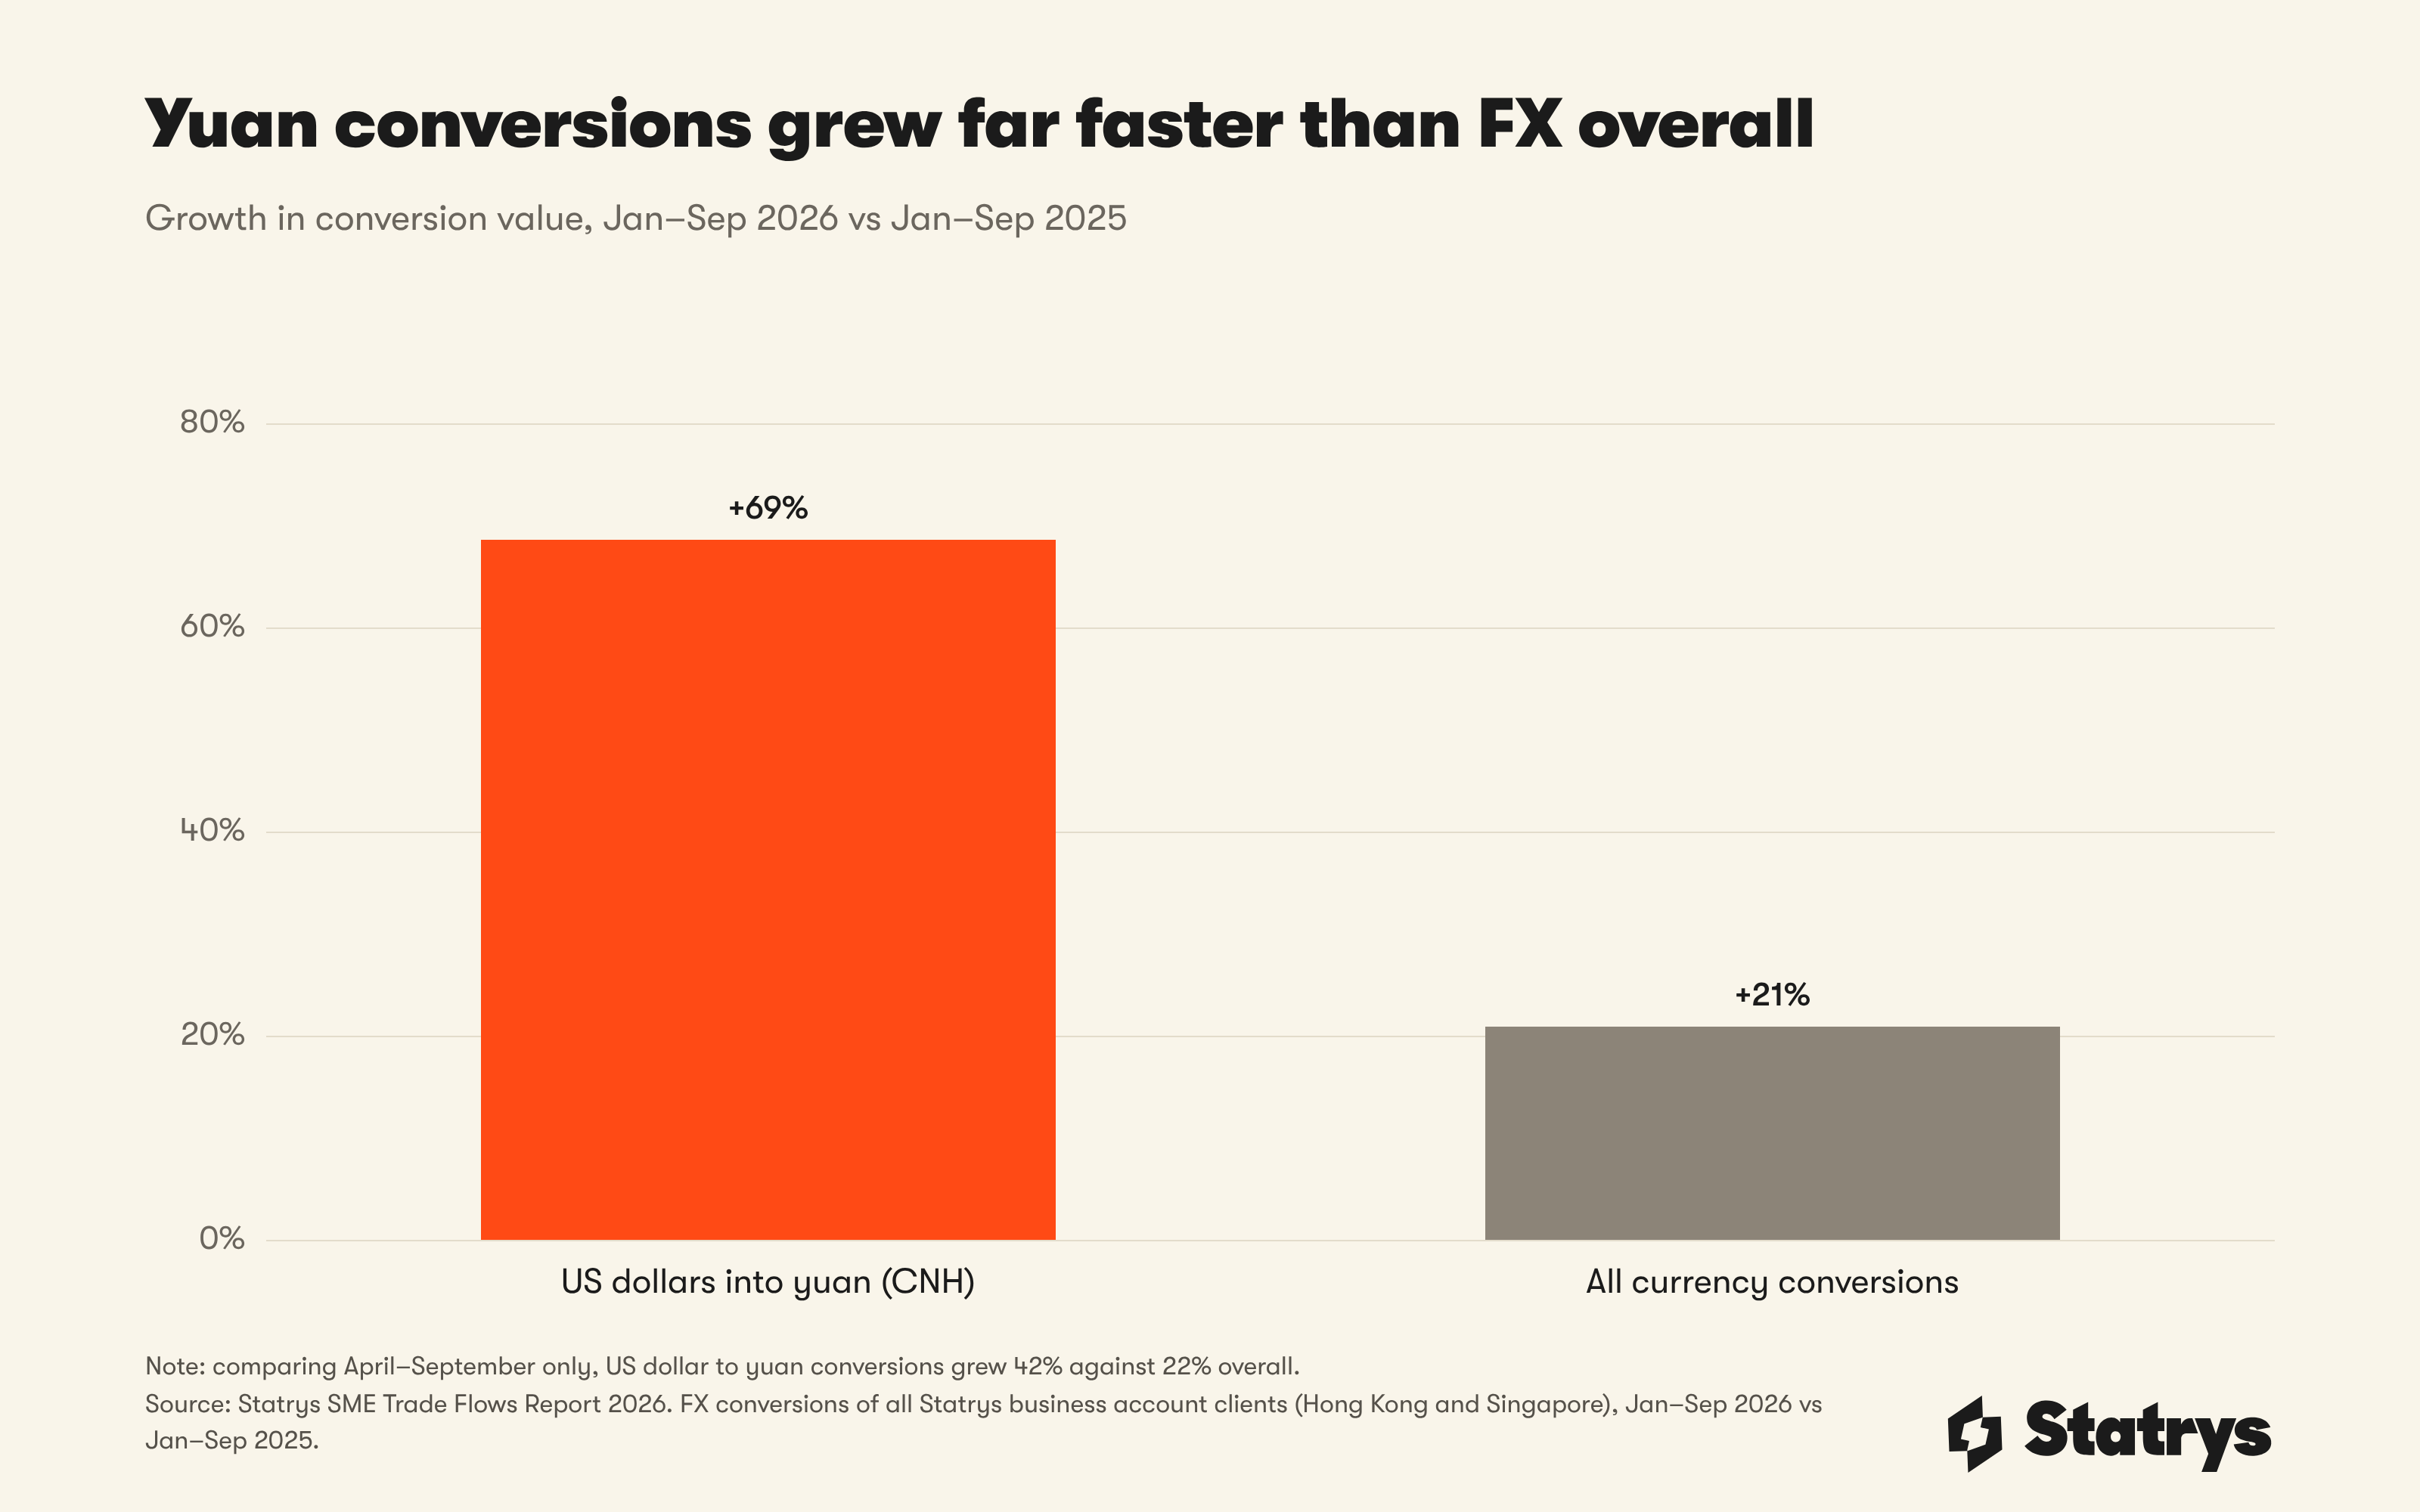
The gap narrows if early 2025 is left out: April to September, dollar-to-yuan conversions grew 42% against 22% overall, still about twice as fast. FX figures cover all our clients, including Singapore-incorporated clients who joined from November 2025, so FX growth rates are not like-for-like.
CNH rose from 5.0% to 6.8% of all currency bought by our Hong Kong and Singapore clients. Net CNH bought roughly doubled (+101%). Yuan is arriving from the other side too: the share of payments from China arriving in CNH rose from 16.2% to 28.5%.
Renminbi deposits in Hong Kong stood at RMB 1,101.5 billion at the end of August 2026 (HKMA, September 2026). Small businesses are taking part in that pool.
What SMEs bought when they converted currency
The euro's share of FX conversions fell from 37.2% to 32.2% and the pound's nearly halved, while the dollar, Hong Kong dollar, yuan and Australian dollar all gained.
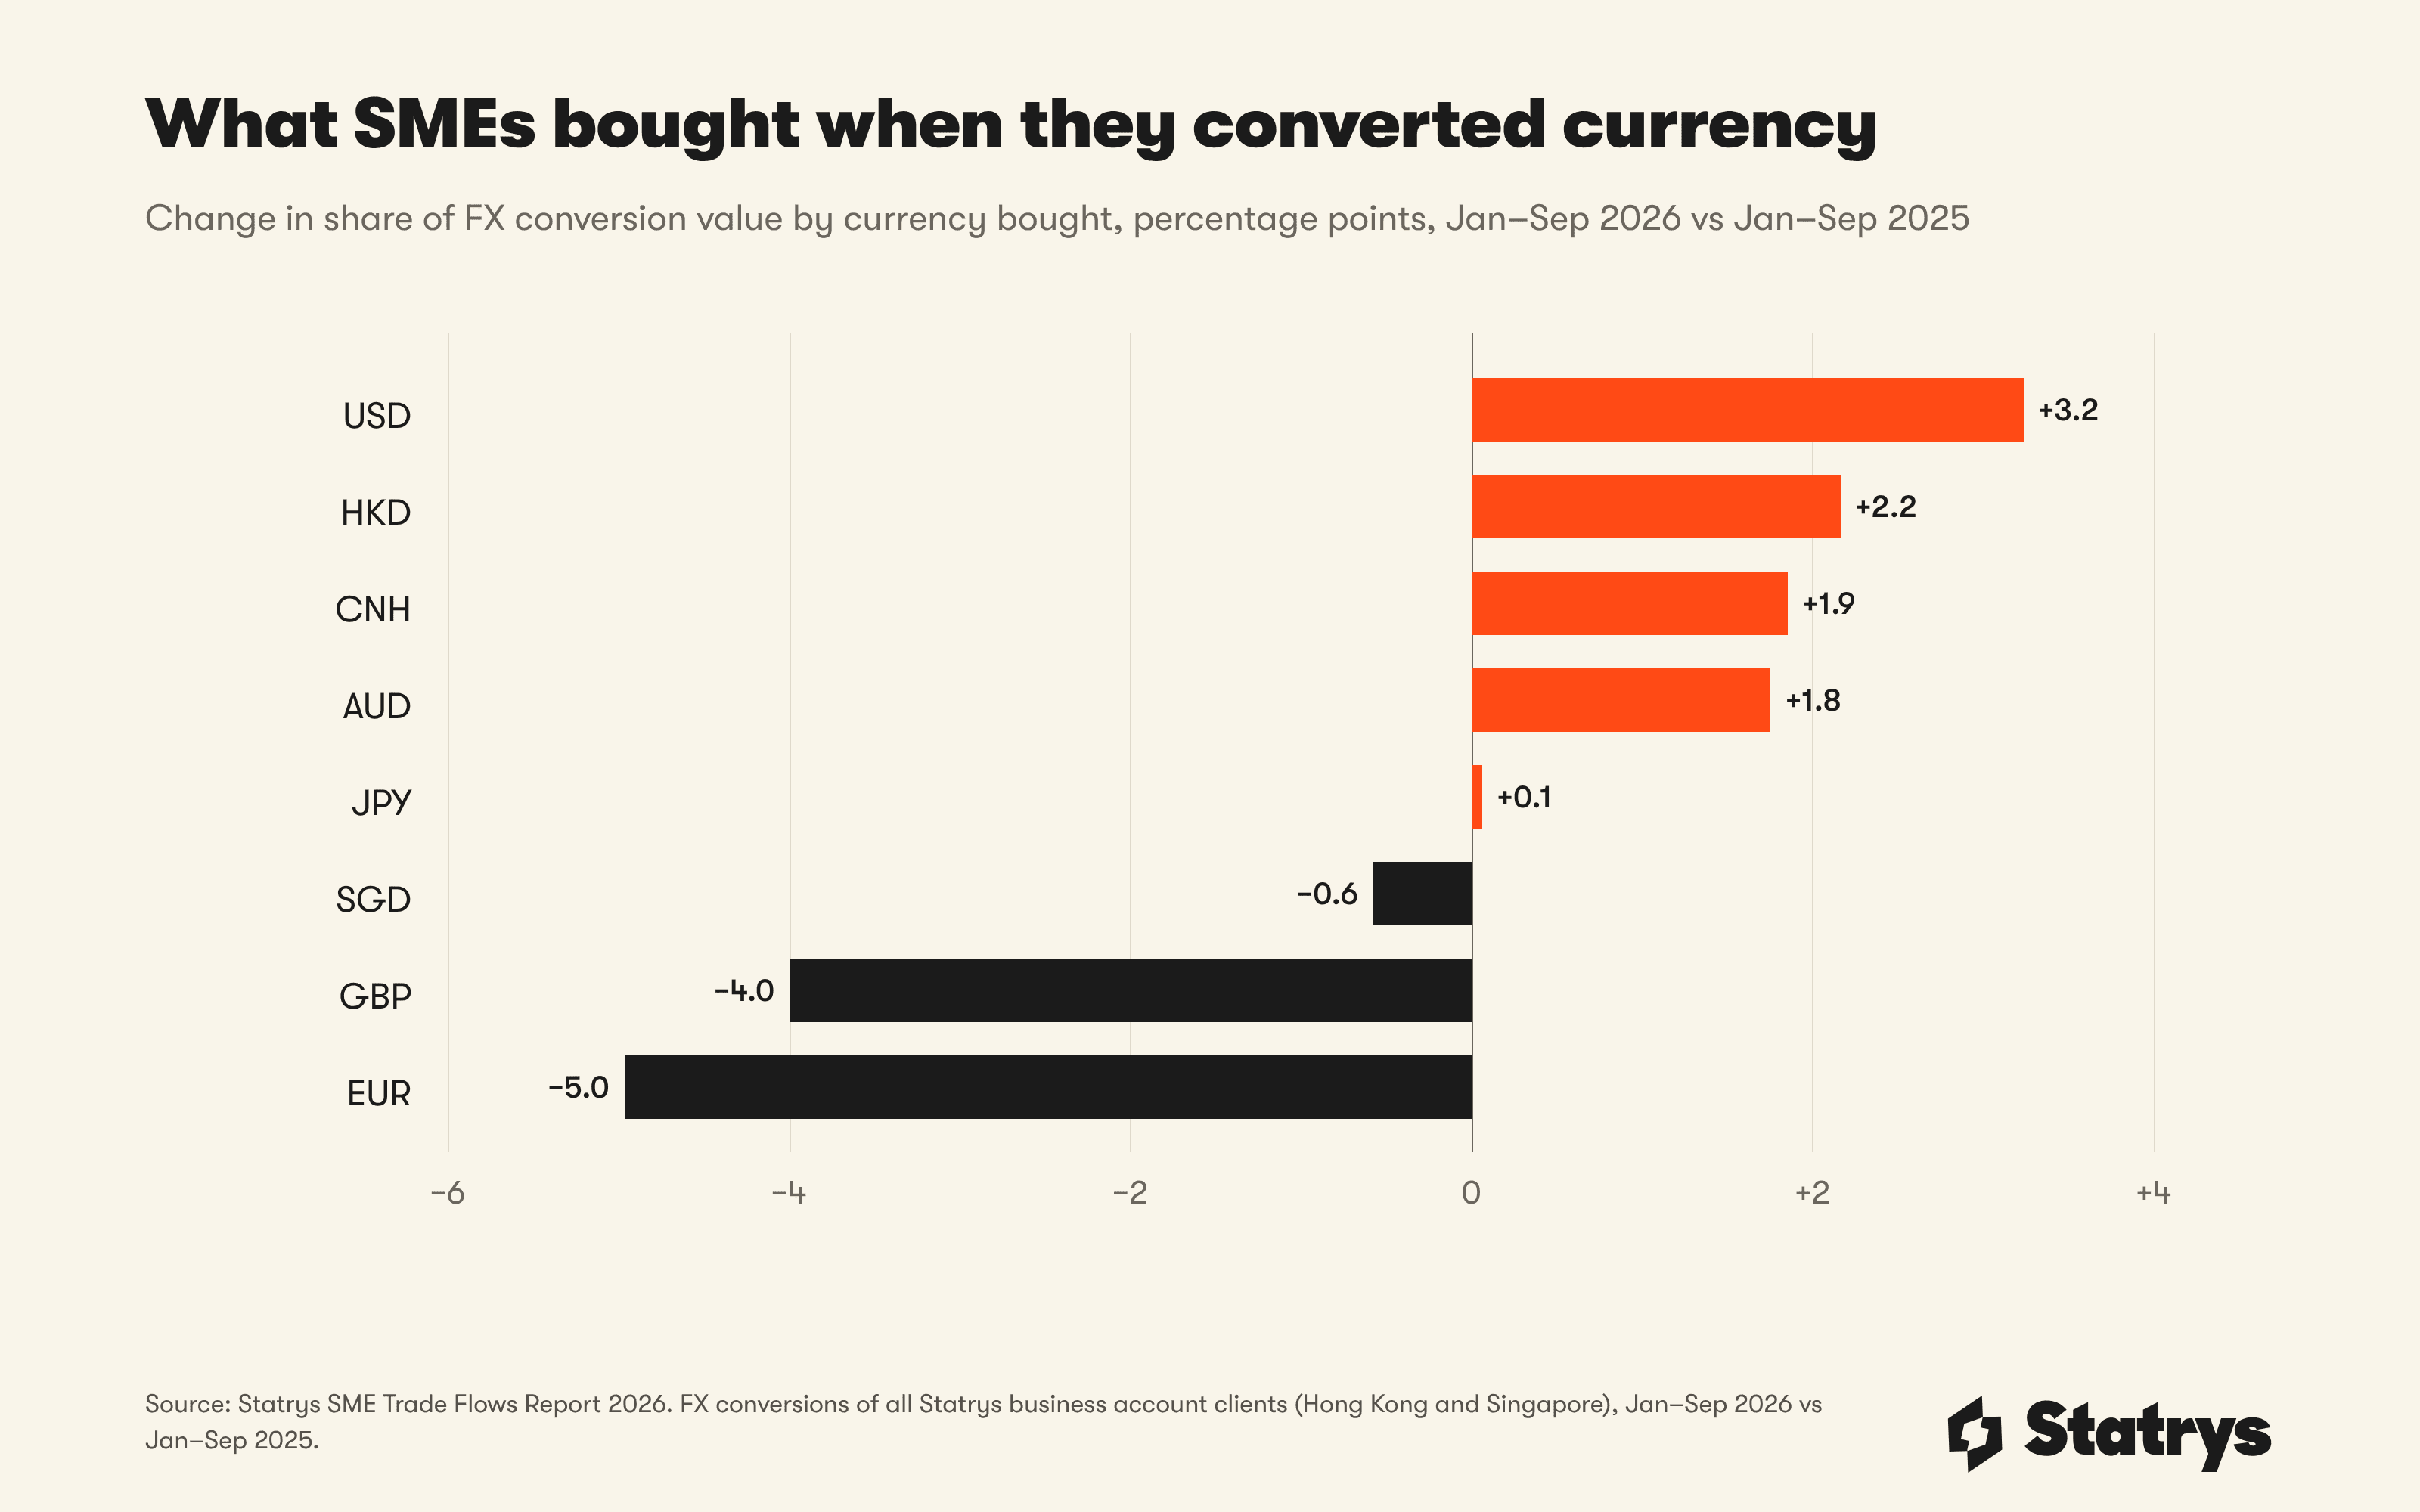
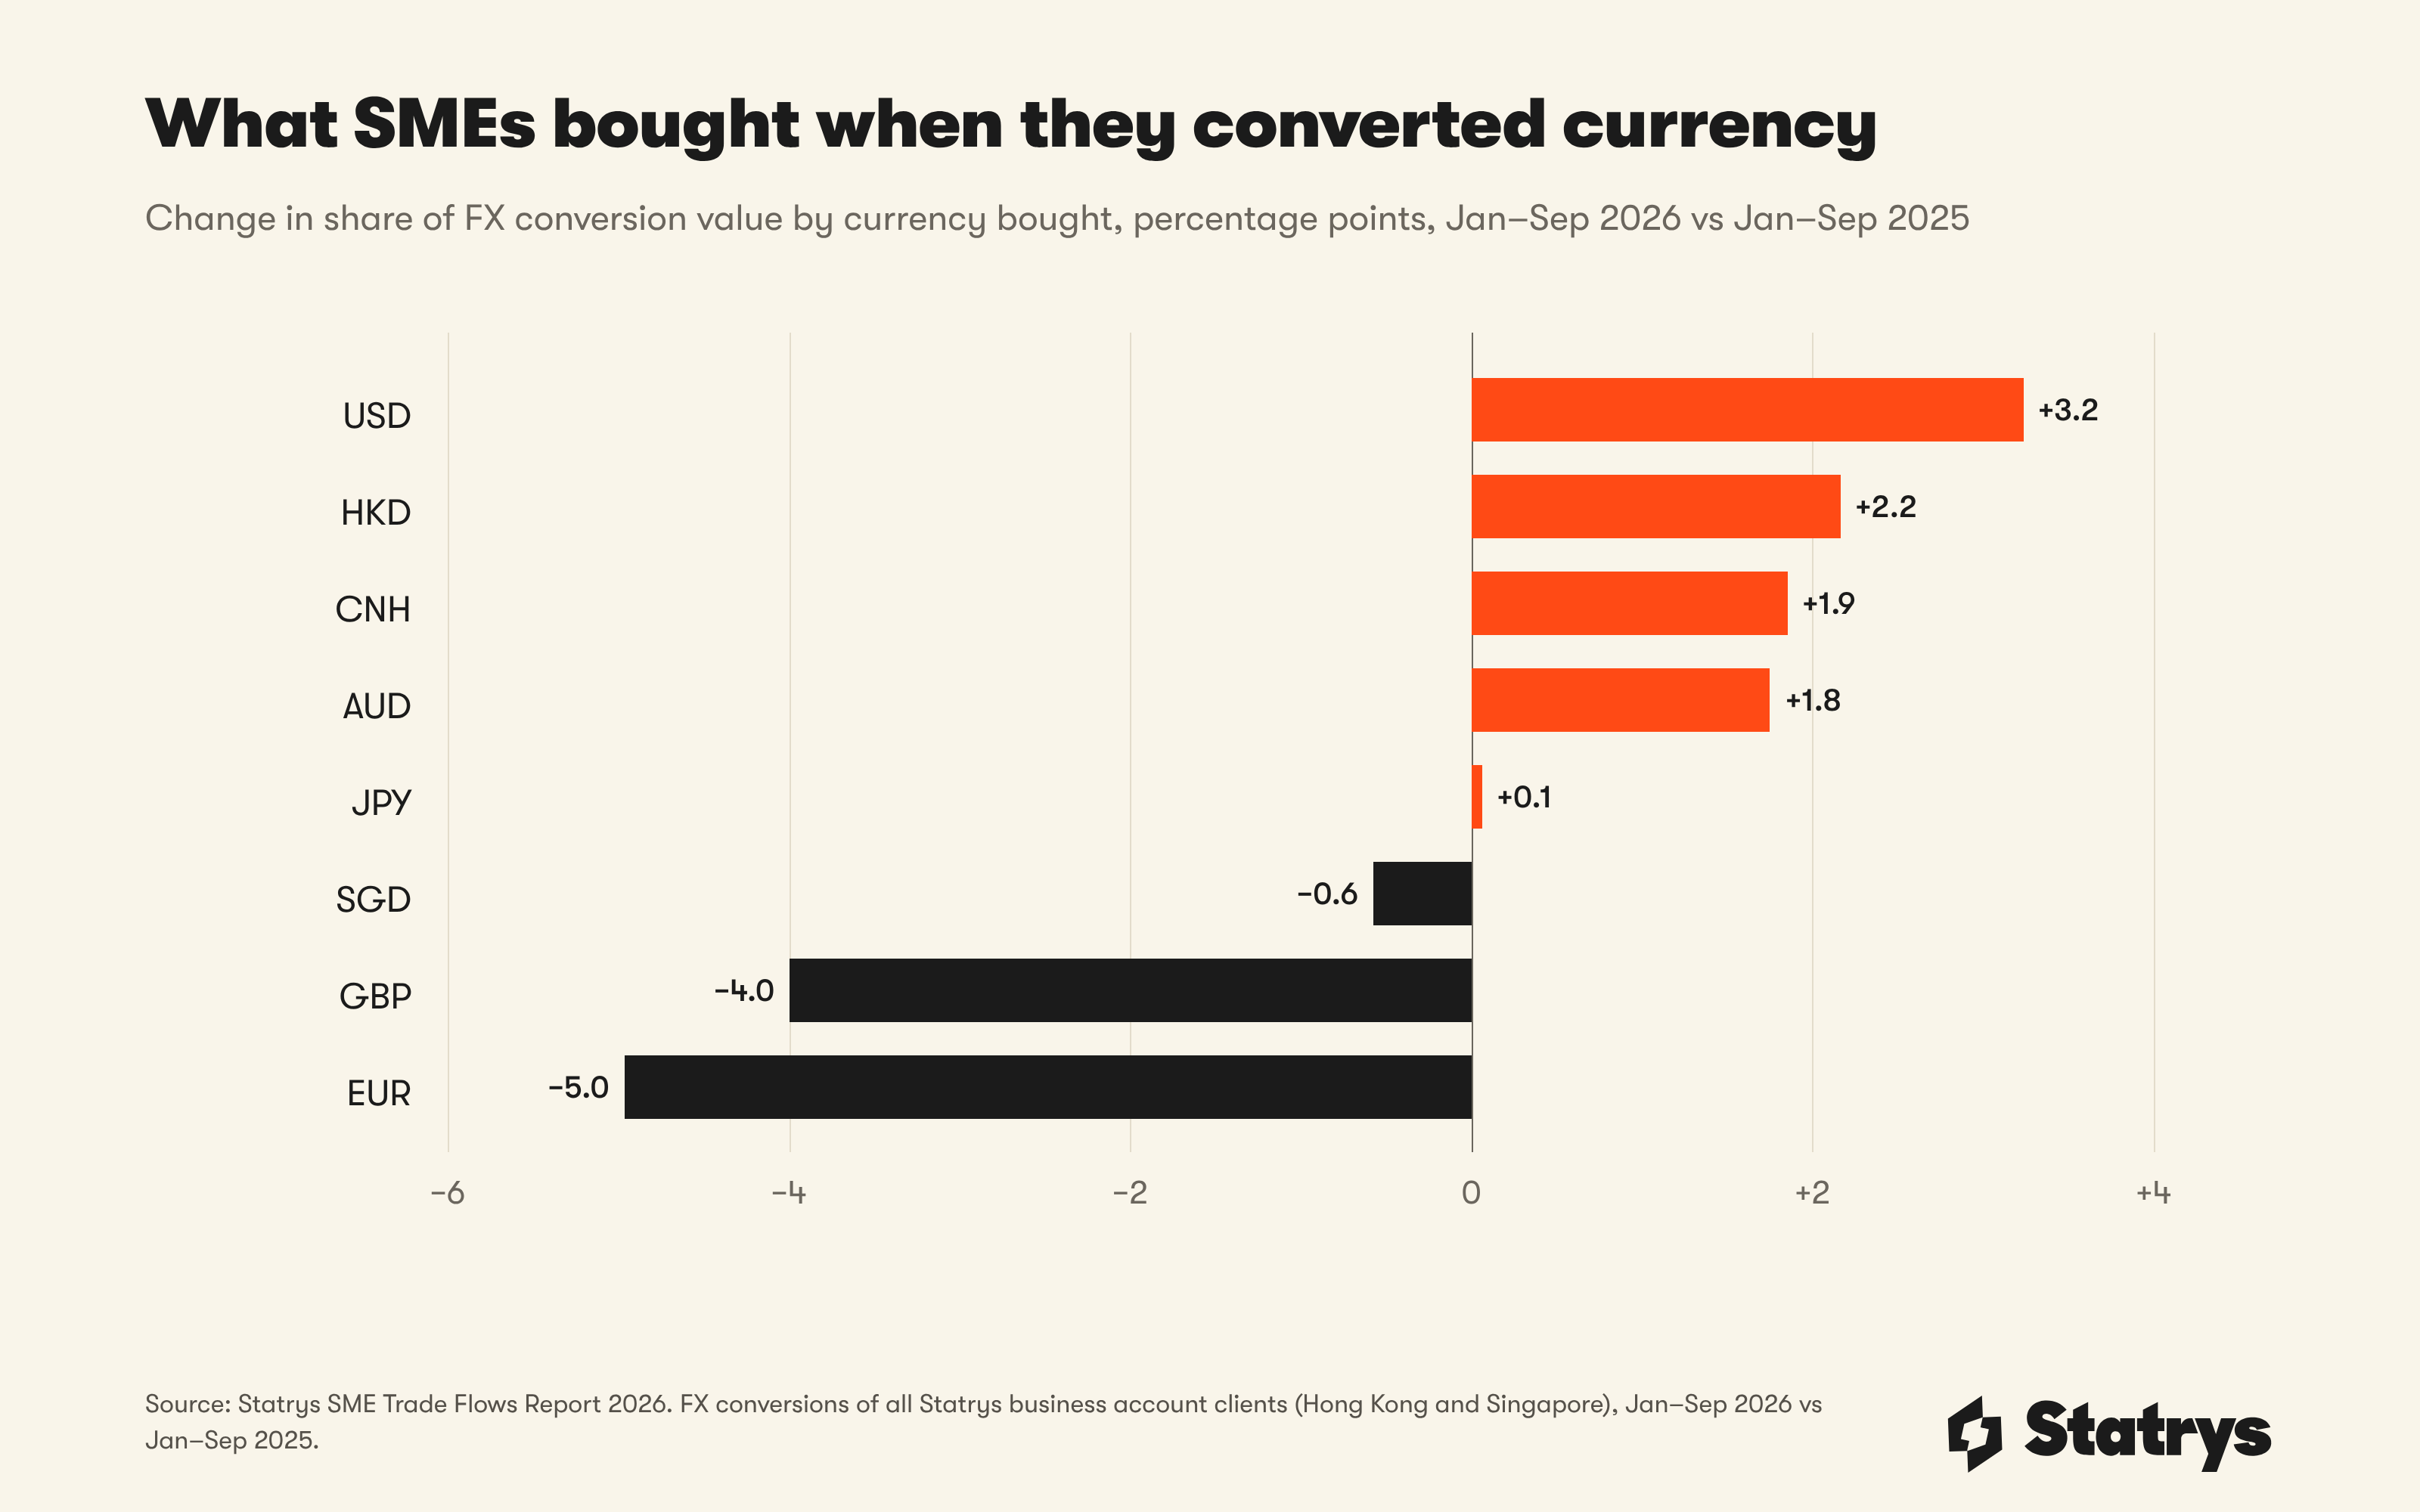
Conversions into British pounds fell 35% in value. Conversions from Hong Kong dollars into US dollars more than doubled (+115%), the largest increase among the ten biggest pairs.
SMEs also convert more often, in smaller amounts: the number of conversions grew 39% while value grew 21%, so the average conversion was 13% smaller. That matches the payments side: more frequent, smaller transactions across more currencies.
China's share: steady going out, rising coming in
China-linked payments made up 14.3% of SMEs' total payment flows, up from 13.2%.
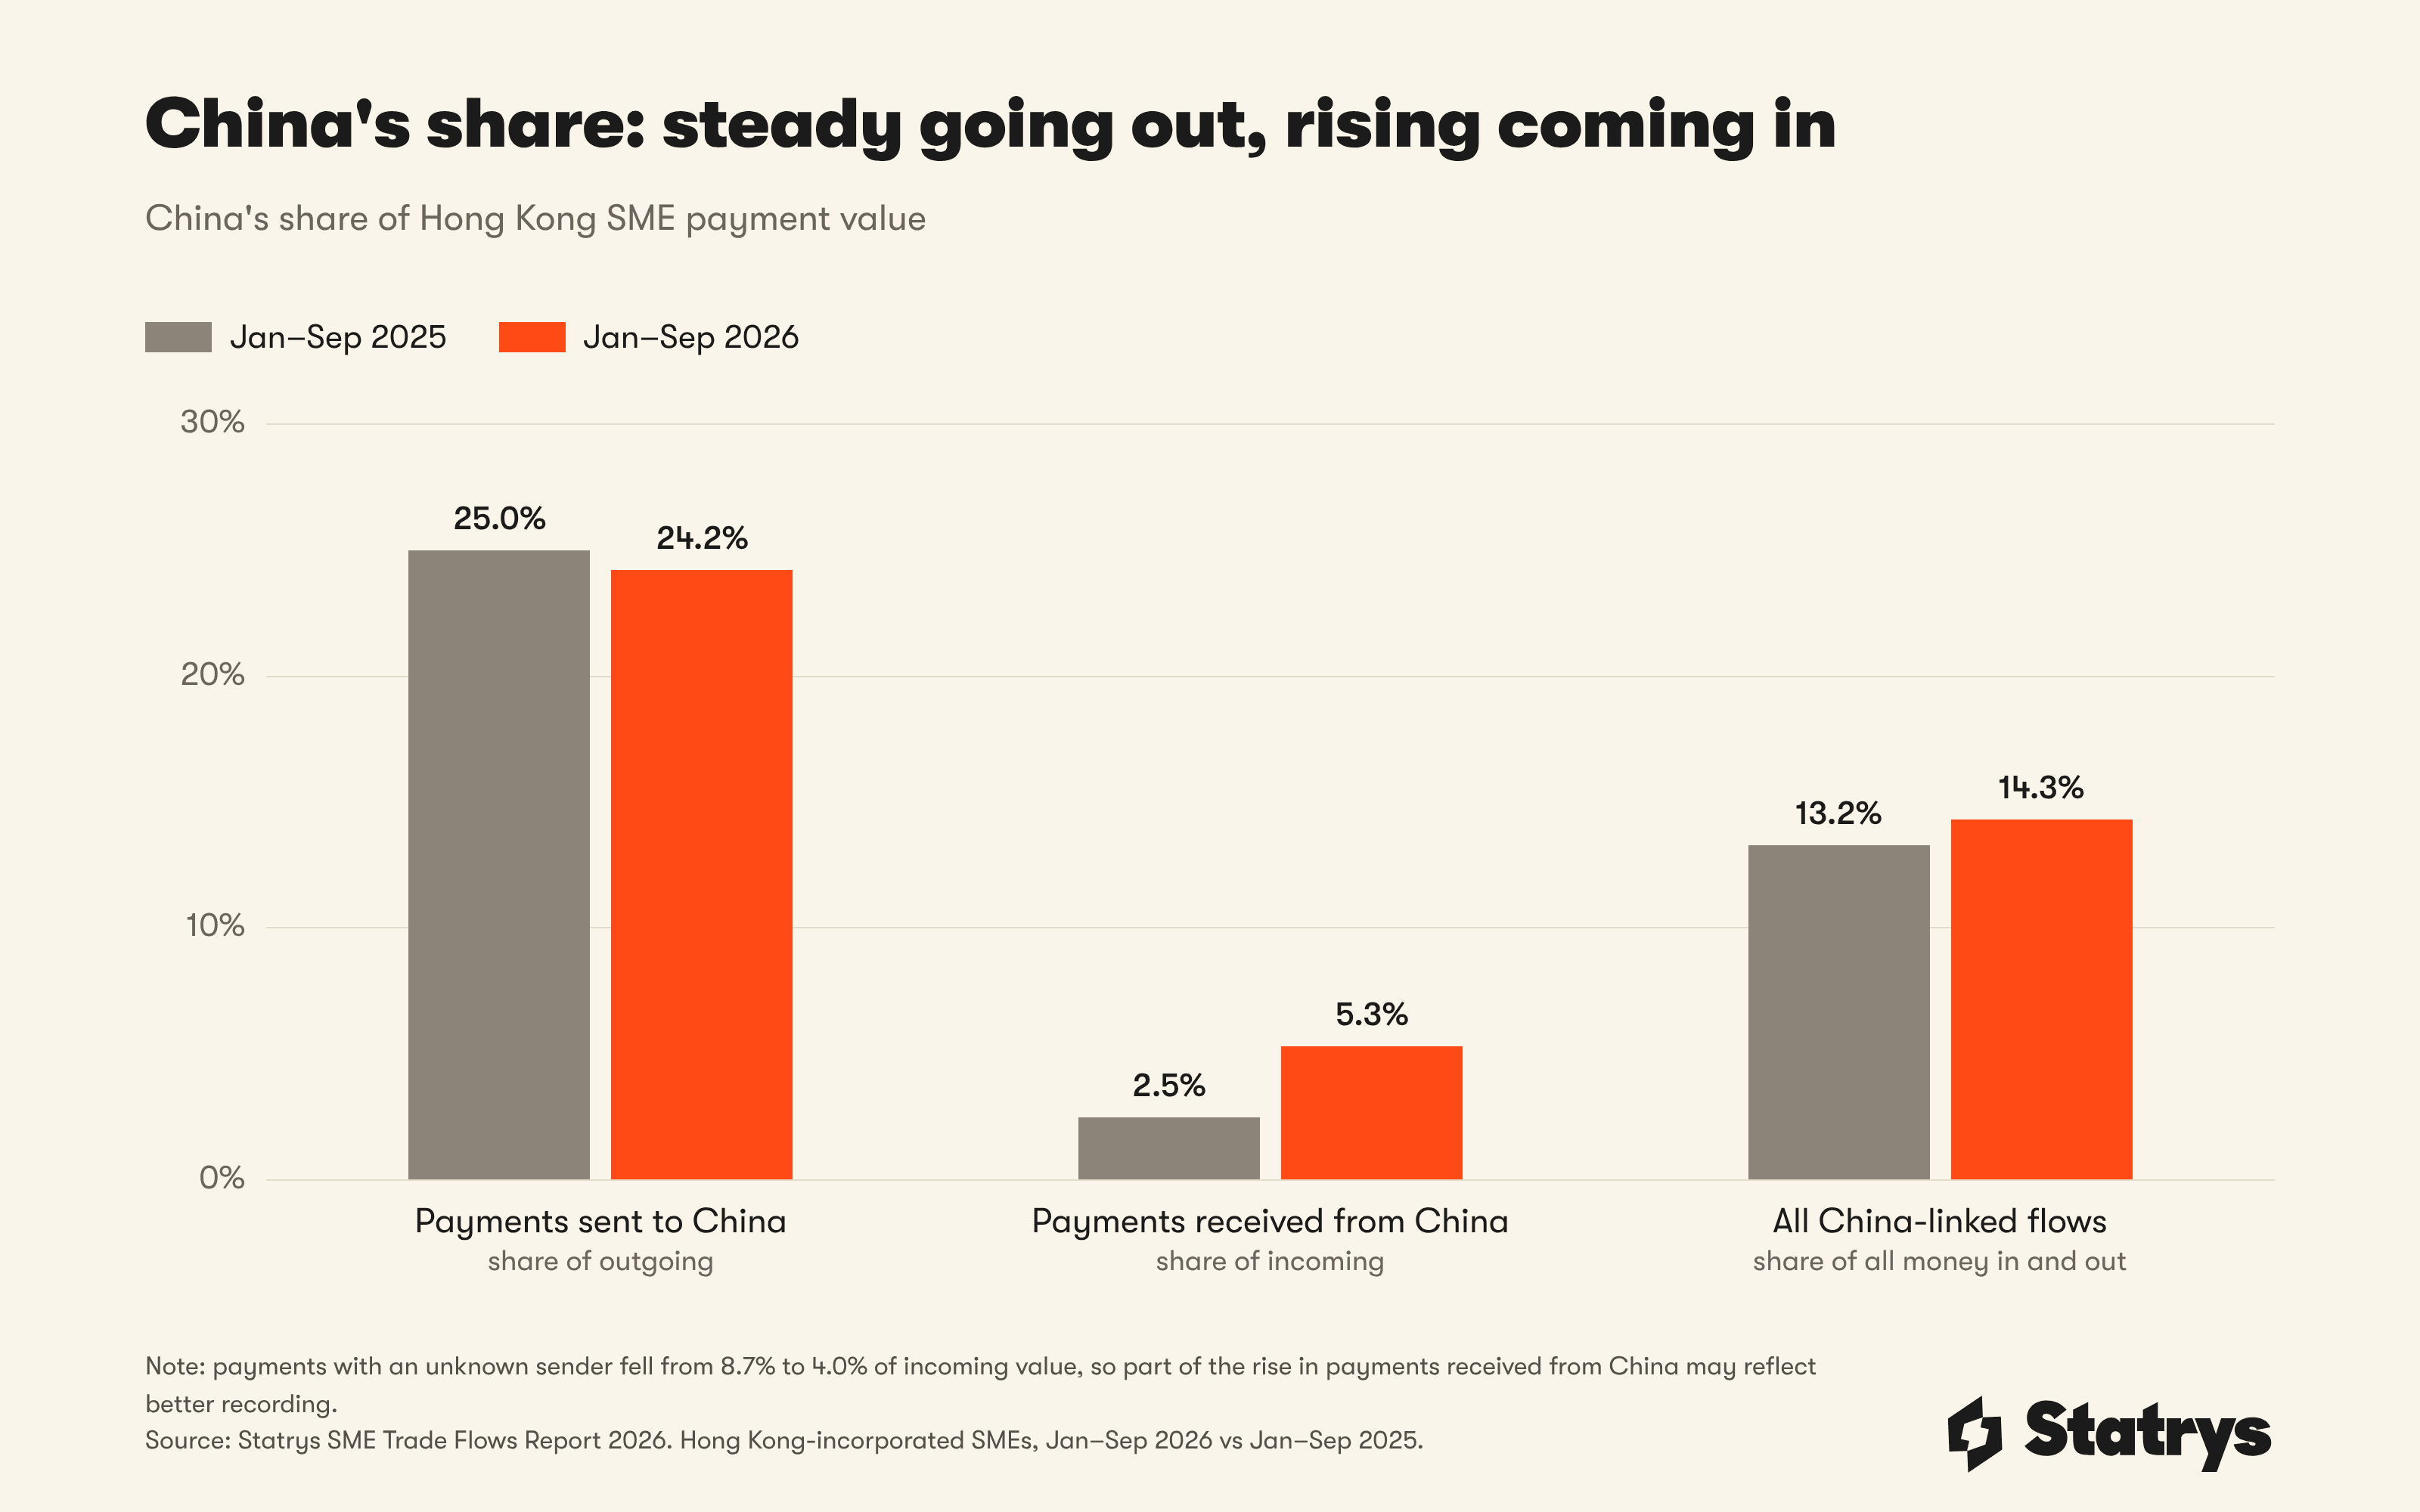
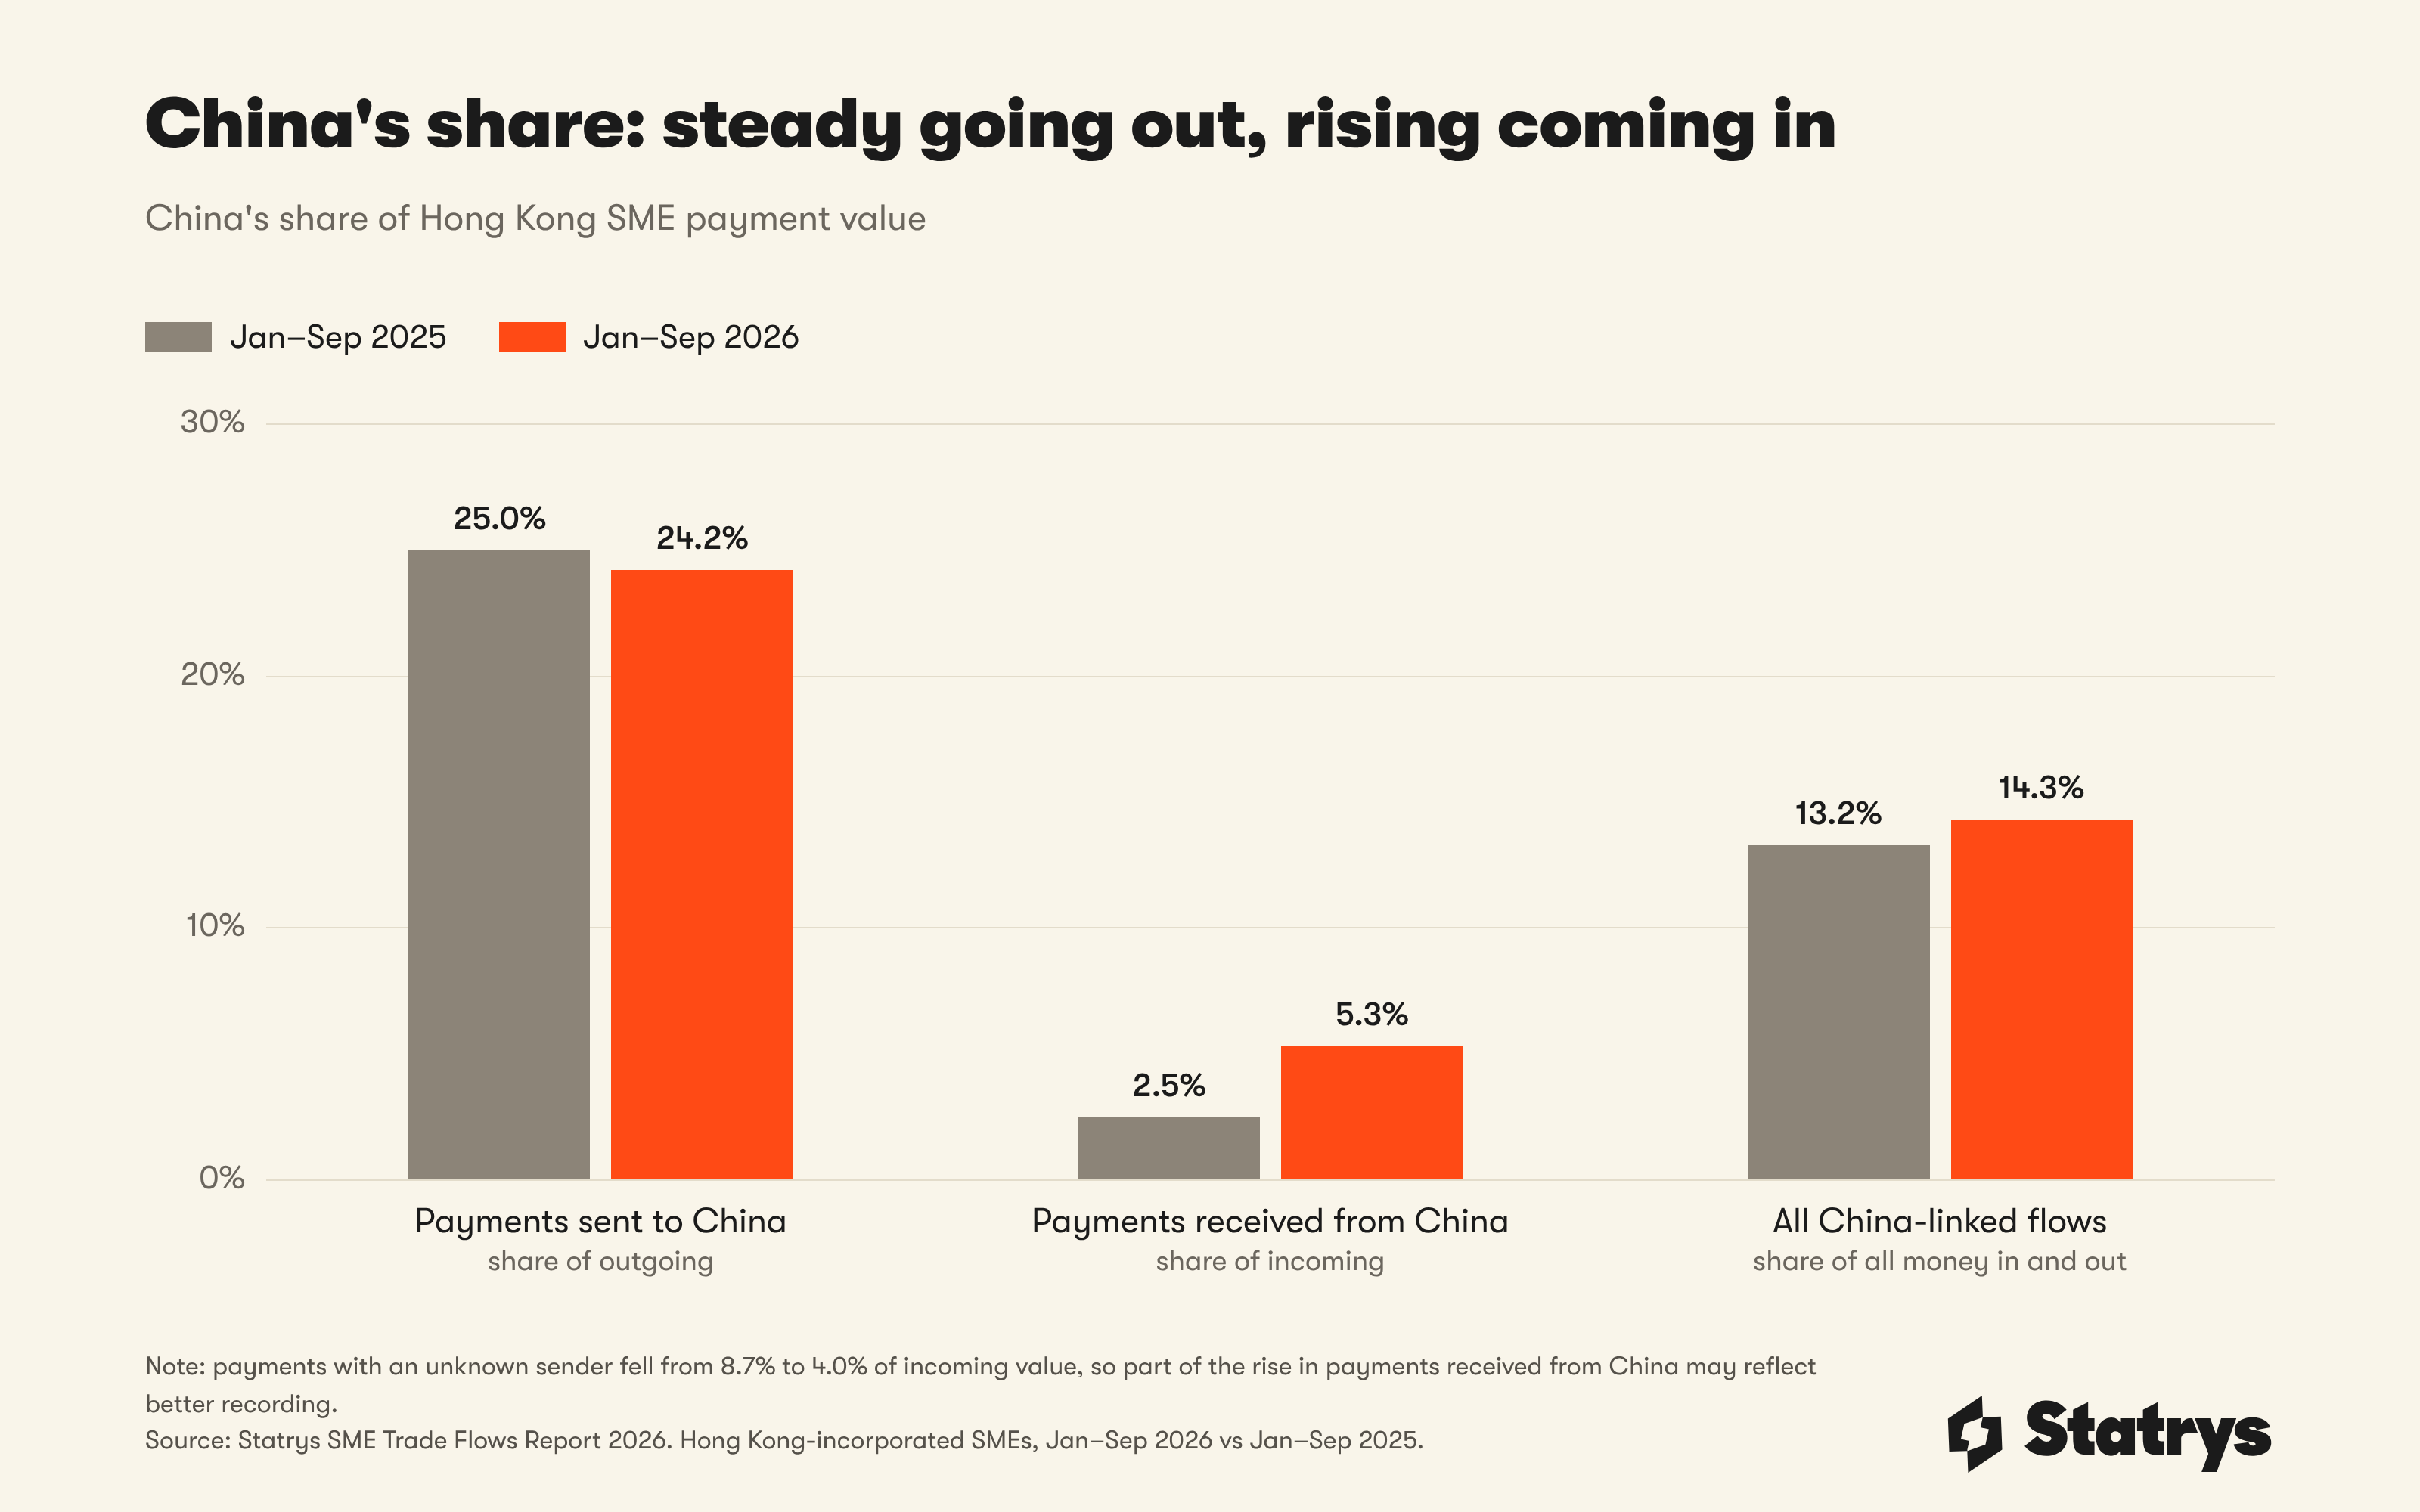
China-linked means money sent to China plus money received from China, measured against all money SMEs sent and received. China's share of payments sent slipped from 25.0% to 24.2%, while its share of payments received more than doubled, from 2.5% to 5.3%. Part of that may reflect better recording of sender countries, so we read it as a sign that Hong Kong's China role is holding, not proof that it is growing.
HKTDC Research raised its 2026 export growth forecast to 42%–47% after exports grew 42.5% in eight months, with exports to the mainland up 46.7% and to ASEAN up 50.9% (HKTDC Research, September 2026). Electronics drove most of it, moved mostly by large companies. Our data shows smaller Hong Kong businesses keeping their China trade at the same time, across a wider set of corridors.
Hong Kong is still where a small business sits between a Chinese supplier and a buyer anywhere else in the world. In 2026, our data shows that role holding firm.
What it means for small traders
Each finding changes something practical for an owner-run trading business. Find the situation closest to yours.
Keep the supplier, cut the currency cost
More than 80% of the value paid to China is paid in US dollars, so the FX margin is the biggest cost. On USD 500,000 of supplier payments, a 1% margin costs about USD 5,000; at 0.3%, about USD 1,500.
Set up the corridor before the first order
Payments grew 209%, 84% and 71%. The first transfer to a new supplier in a new country is the one most likely to be held up, and a delayed deposit can delay production.
Watch receivables, not only tariffs
Money from US customers fell 1% while payments to US counterparties grew 20%. Tariff pressure tends to travel back to the seller as lower prices, smaller orders or slower payment.
Treat CNH as a working balance
Payments from China arriving in yuan rose from 16.2% to 28.5%. Converting yuan to dollars and back to pay a supplier means paying the margin twice.
Watch per-payment fees
Payments to India grew 32% in number while the average fell 54%. A USD 25 fee is 0.1% of a USD 25,000 payment but 2.5% of a USD 1,000 one.
Expect more dollar invoices from Europe
The dollar's share of payments to EU countries rose from 17.5% to 27.9%. Earn euros but pay dollars, and you carry currency risk on both sides.
These scenarios are general information, not financial, tax or legal advice. Fees, rates and payment rules vary by provider and country, so check what applies to your business before acting.
Four questions for our next edition
2026 growth came mainly from larger payments. Broader adoption would make it look more like China's corridor.
Section 301 tariffs of 12.5% on Hong Kong goods started on 24 July. HKTDC expects a limited direct impact; small-business receipts will show whether that holds.
More CNH-settled supplier payments would be the first real sign of a shift away from the dollar.
That would confirm a two-currency pattern: dollars for Asia and the Americas, euros for Europe.
All 13 figures in one place
Hong Kong-incorporated Statrys business account clients, payments to and from third parties only. Free to quote with credit and a link.
| Metric | Jan–Sep 2025 | Jan–Sep 2026 |
|---|---|---|
| Growth in outgoing payment value | baseline | +15% |
| Growth in incoming payment value | baseline | +16% |
| Southeast Asia's share of outgoing payments | 9.2% | 12.5% |
| China's share of outgoing payments | 25.0% | 24.2% |
| Vietnam's share of outgoing payments | 0.6% | 1.7% |
| India's share of outgoing payments | 4.5% | 2.4% |
| EU countries' share of outgoing payments | 13.3% | 14.6% |
| US share of incoming payments | 15.1% | 12.9% |
| US dollar share of outgoing payments | 68.7% | 72.0% |
| US dollar share of payments to China | 80.8% | 83.4% |
| US dollar share of payments to EU countries | 17.5% | 27.9% |
| CNH share of FX bought (HK and SG clients) | 5.0% | 6.8% |
| China-linked share of total payment flows | 13.2% | 14.3% |
How we built the data
Aggregated payment data from Statrys business accounts held by Hong Kong-incorporated companies, mostly owner-run trading and services businesses, and FX data from all Statrys business account clients. Every payment is converted to a US dollar equivalent so 19 currencies can be compared.
What could skew the results, and what we did about it +
| Risk | What we did |
|---|---|
| Unusual months in early 2025 | Re-ran every finding on April–September only. Where the reading changes, the text says so: China's share, the yuan's share of payments to China, and Vietnam (+160% April–September, still more than double) |
| A few large clients driving a corridor | Corridors averaging under 30 paying clients a month are not headline findings; under 10 are not reported. The UAE is flagged |
| Statrys gained clients | We publish shares, not volumes. Growth rates include payments from new clients, and a changing client mix can still move shares |
| Clients are not the whole market | Findings describe Hong Kong-incorporated SMEs that trade internationally and manage their payments online, not every Hong Kong business |
| Country may be the bank's country | Where the record shows the bank's country rather than the supplier's, a mainland supplier paid into a Hong Kong account appears as Hong Kong, so China's share may be understated |
How to read the numbers +
| Term | What it means | Example |
|---|---|---|
| Share of outgoing payments | Value paid to a country or region, divided by everything SMEs paid to third parties, including within Hong Kong | Southeast Asia: 12.5% |
| Percentage-point change | 2026 share minus 2025 share | 9.2% → 12.5% = +3.3 pts |
| Growth | 2026 value ÷ 2025 value − 1 | Vietnam: +209% |
| Tripled | 2026 value at least three times 2025 | Vietnam: 3.1× |
Definitions: regions and countries +
Southeast Asia means ASEAN's 11 members, including Timor-Leste (joined October 2025). EU means the 27 member states. Hong Kong includes domestic FPS and CHATS payments. Singapore-incorporated clients joined from November 2025 and are excluded from payment findings.
All data is aggregated. No client is named or identifiable, and apart from the sample size, we publish only shares, percentage-point changes and growth rates.
Use this data
Quick answers
Are small businesses moving their supply chains out of China in 2026?+
No. China received 24.2% of the outgoing payment value of Hong Kong-incorporated SMEs in January to September 2026, close to 25.0% a year earlier, and payments to China grew 11%. SMEs added suppliers elsewhere instead: Southeast Asia's share rose from 9.2% to 12.5%, and payments to Vietnam grew 209%.
Is the Chinese yuan replacing the US dollar in SME trade?+
No. The US dollar settled 72.0% of outgoing payments, up from 68.7%, and 83.4% of payments to China. Yuan demand is growing in other ways: conversions from US dollars into CNH by Hong Kong and Singapore clients grew 69%, and the CNH share of payments received from China rose from 16.2% to 28.5%.
Why are Hong Kong SME payments to Vietnam growing so fast?+
Payments to Vietnam grew 209%, consistent with businesses adding Vietnamese suppliers alongside Chinese ones. Vietnam starts from a small base (1.7% of outgoing value). The average payment nearly doubled (+95%) while the number of payments grew 59%, so growth came mainly from larger payments.
Are US tariffs affecting Hong Kong small businesses?+
Payments received from US customers fell 1% and the US share of incoming payments dropped from 15.1% to 12.9%, while payments to US counterparties grew 20%. The data shows the pattern, not its cause.
Where does the data in this report come from?+
Aggregated payment data from Statrys business accounts held by Hong Kong-incorporated companies, January to September 2025 and 2026, plus FX conversion data for all Statrys business account clients. Currency conversions and own-account transfers are excluded. Apart from the sample size, we publish only shares, percentage-point changes and growth rates. Public context comes from the WTO, the IMF, the New York Fed, Swift, HKTDC Research, the HKMA, AmCham China, ING, China's customs administration and Vietnam's National Statistics Office.

Disclaimer. This report is for general information only and is not financial, tax or legal advice. The figures are based on aggregated, anonymised data from Statrys clients and may not reflect the wider market. Please seek professional advice before making decisions based on it.
About our licences. Statrys is not a bank. Statrys Limited is licensed as a Money Service Operator (No. 19-02-02726) in Hong Kong. Statrys Singapore Pte. Ltd. is licensed by the Monetary Authority of Singapore (MAS) as a Major Payment Institution under the Payment Services Act 2019 (Licence No. PS20200692).